|
Next update One advantage of subscribing to Incredible Charts is that you will never have to purchase a software upgrade: your software is upgraded automatically with each live update. The next update will be available in the next few days. The new version offers further improvements to the watchlist menu, powerful new scrolling features and enables members to use Large Font settings on their laptop (or desktop) computers. |
Trading Diary
September 3, 2003
These extracts from my daily trading diary
are for educational purposes
and should not be interpreted as investment
advice. Full terms and conditions can be found at Terms
of Use .
USA
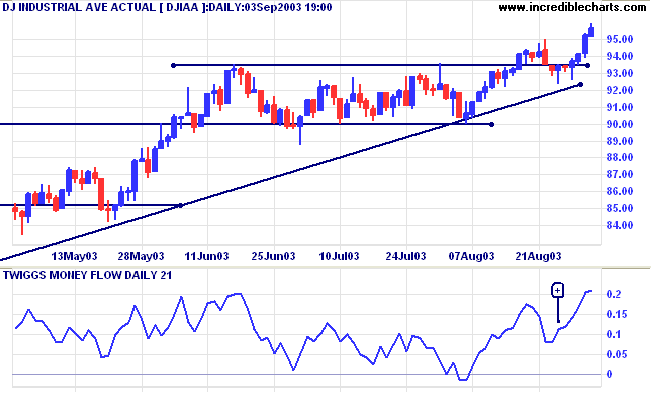
The Dow Industrial Average gained a further 0.5%
to close at 9568 on higher volume, continuing to make new 1-year
highs.
The intermediate trend is up.
The primary trend is up.
Twiggs Money Flow and MACD are both bullish.
The intermediate trend is up.
The primary trend is up.
Twiggs Money Flow and MACD are both bullish.
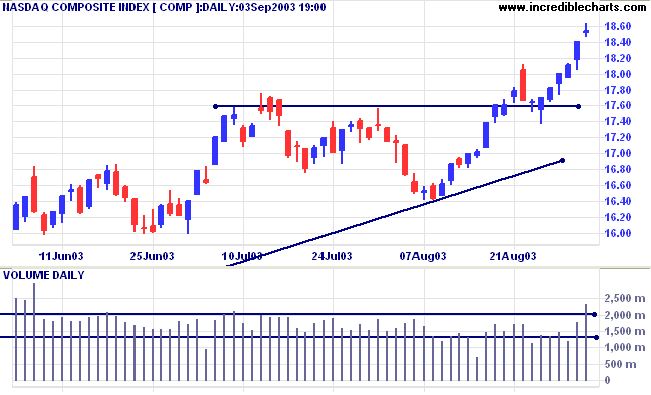
The Nasdaq Composite gapped up 12 points at
1853, forming a doji
star on strong volume. The pattern signals a reversal if
there is a close more than half way down the body of the previous
bar (i.e. below 1829).
The intermediate trend is up.
The primary trend is up.
The intermediate trend is up.
The primary trend is up.
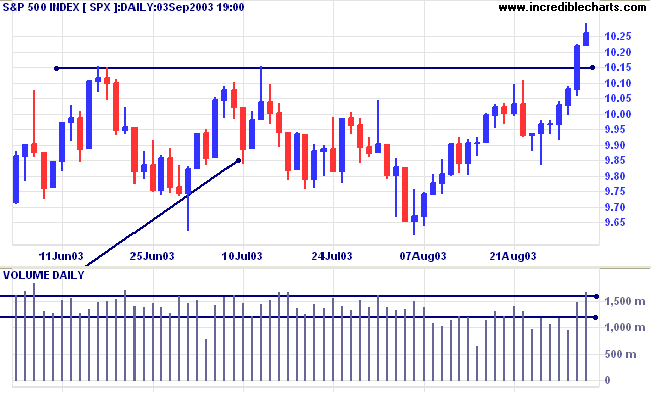
The S&P 500 gained 4 points to close at 1026
on strong volume.
The intermediate trend is up.
The primary trend is up.
The intermediate trend is up.
The primary trend is up.
The Chartcraft NYSE Bullish % Indicator continues
to rise, reaching a new ten-year high of 78.98% (September
3).
Market Strategy
Short-term: Long above 1022.
Intermediate: Long if the index is above 1015.
Long-term: Long if the index is above 960.
Short-term: Long above 1022.
Intermediate: Long if the index is above 1015.
Long-term: Long if the index is above 960.
Cars sales zoom
Domestic vehicle sales are well above forecasts, a healthy sign for a recovery. (more)
Domestic vehicle sales are well above forecasts, a healthy sign for a recovery. (more)
Treasury yields
After consolidating above its new support level, the 10-year treasury note yield held at 4.60%.
The intermediate and primary trends are both up.
After consolidating above its new support level, the 10-year treasury note yield held at 4.60%.
The intermediate and primary trends are both up.
Gold
New York (20.21): Spot gold is 3 dollars up at $374.20.
The primary trend is up.
Price has broken above a symmetrical triangle, with a target of 420. There is still some resistance at 382.
New York (20.21): Spot gold is 3 dollars up at $374.20.
The primary trend is up.
Price has broken above a symmetrical triangle, with a target of 420. There is still some resistance at 382.
ASX Australia
The All Ordinaries formed a gravestone
candlestick, reversing after an early rally to close down 5
points at 3219 on strong volume. Heavy volume often precedes a
correction, so we need to be on the alert. Positive performance
of US markets may negate this.
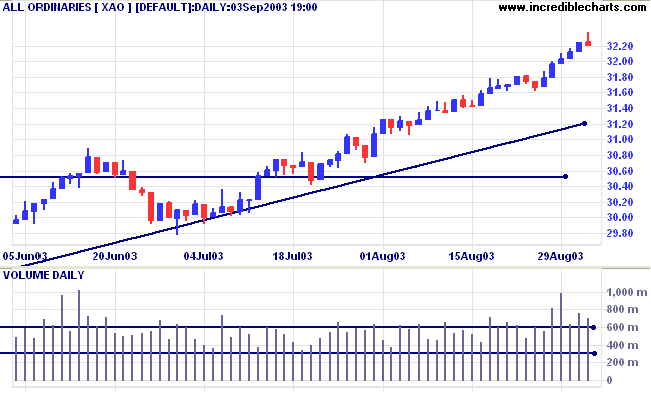
The intermediate trend and primary trend are both up.
MACD (26,12,9) is above its signal line; Slow Stochastic (20,3,3) has swung below its signal line;
Twiggs Money Flow signals accumulation.
MACD (26,12,9) is above its signal line; Slow Stochastic (20,3,3) has swung below its signal line;
Twiggs Money Flow signals accumulation.
Market Strategy
Short-term: Long if the XAO is above 3237.
Intermediate: Long if the index is above 3162.
Long-term: Long if the index is above 2978 .
Short-term: Long if the XAO is above 3237.
Intermediate: Long if the index is above 3162.
Long-term: Long if the index is above 2978 .
Property sector
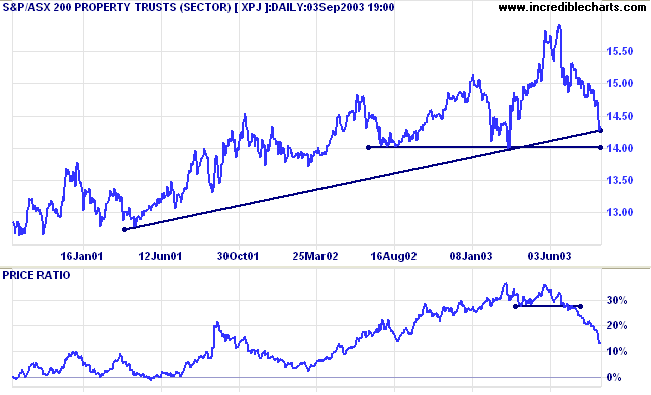
The Property index [XPJ] threatens to break below its long-term upward trendline. The trendline is only a momentum indicator and a reversal to a stage 4 down-trend will only take place when price breaks through support at 1400.
Relative Strength has fallen to a new 1-year low.
The Property index [XPJ] threatens to break below its long-term upward trendline. The trendline is only a momentum indicator and a reversal to a stage 4 down-trend will only take place when price breaks through support at 1400.
Relative Strength has fallen to a new 1-year low.
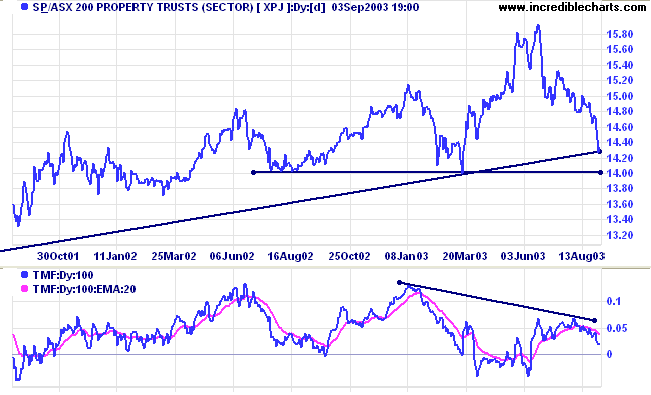
Twiggs Money Flow (100) displays a bearish divergence, while MACD
has completed two bearish peaks below zero.
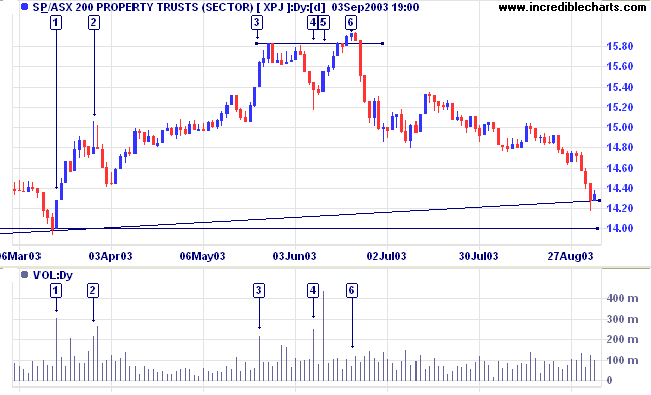
The daily volume chart shows a surge in volume at [1] as price
rallies above the support level.
Weak closes and high volume at [2] signal distribution.
The fast rally at [3] is accompanied by strong volume.
After a failed attempt to break above the previous high, price retreats to [4]. The weak close and high volume signal accumulation at the 1532 support level.
The next rally starts with heavy volume at [5] but fades to low volume at [6]; a false break above the previous high.
Price has since retreated on light volume, falling through several support levels, before pausing briefly at the long-term trendline. Volume has given no sign of a reversal.
The true test will come at 1400.
Understanding
the Trading Diary has been expanded to offer further
assistance to readers.
Colin Twiggs
You are neither right nor wrong because the
crowd disagrees with you.
You are right because your data and reasoning are right.
~ Warren Buffet
You are right because your data and reasoning are right.
~ Warren Buffet
Setting up a Watchlist
|
The quickest way to set up a watchlist is to use the
Stock Screen menu. To create a watchlist of the ASX 50:
You will now have a watchlist of the ASX 50. You can
add and delete individual stocks as you please.
|
Back Issues
You can now view back issues at the Daily Trading Diary Archives.
You can now view back issues at the Daily Trading Diary Archives.
Back Issues
Access the Trading Diary Archives.

Author: Colin Twiggs is a former investment banker with almost 40 years of experience in financial markets. He co-founded Incredible Charts and writes the popular Trading Diary and Patient Investor newsletters.
Using a top-down approach, Colin identifies key macro trends in the global economy before evaluating selected opportunities using a combination of fundamental and technical analysis.
Focusing on interest rates and financial market liquidity as primary drivers of the economic cycle, he warned of the 2008/2009 and 2020 bear markets well ahead of actual events.
He founded PVT Capital (AFSL No. 546090) in May 2023, which offers investment strategy and advice to wholesale clients.