|
US Data - Monday I may have succeeded in confusing most readers with my message yesterday. We received an update file from our data supplier, despite the market being closed for Labor Day. Most indexes were blank (as one would expect), except for the few that have international input. Apologies to anyone who waited for an update. At least all were aware that there was no index data despite the time stamp showing otherwise. |
Trading Diary
September 2, 2003
These extracts from my daily trading diary
are for educational purposes
and should not be interpreted as investment
advice. Full terms and conditions can be found at Terms
of Use .
USA
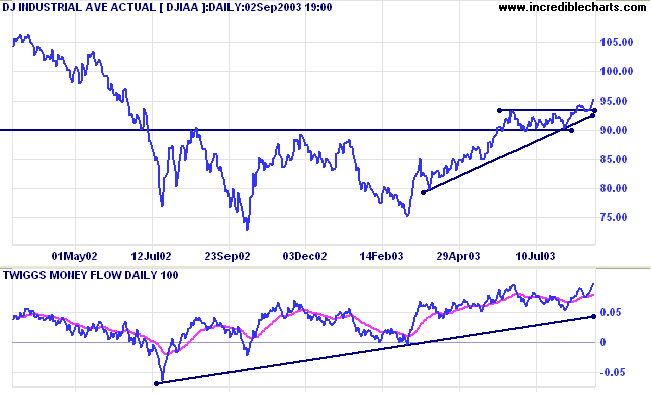
The Dow Industrial Average rallied to a new
1-year high at 9523 on higher volume. After consolidating above
the 9000 support level the index has made a clear upward
break.
The intermediate trend is up.
The primary trend is up.
The intermediate trend is up.
The primary trend is up.
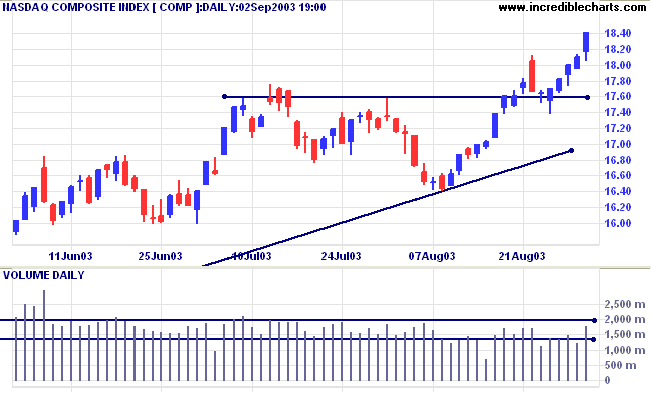
The Nasdaq Composite rallied to a new 1-year
high of 1841 on higher volume.
The intermediate trend is up.
The primary trend is up.
The intermediate trend is up.
The primary trend is up.
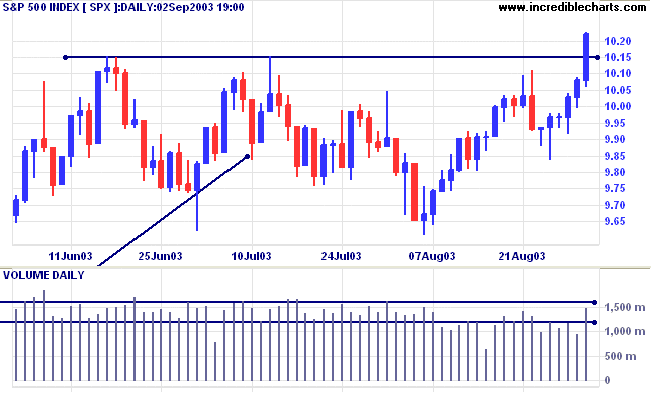
The S&P 500 broke through resistance at 1015
to close at a new 1-year high of 1022 on higher volume.
The intermediate trend has reversed up.
The primary trend is up.
The intermediate trend has reversed up.
The primary trend is up.
The Chartcraft NYSE Bullish % Indicator has risen
to a ten-year high of 78.50% (September 2).
Market Strategy
Short-term: Long above 1015.
Intermediate: Long if the index is above 1015.
Long-term: Long if the index is above 960.
Short-term: Long above 1015.
Intermediate: Long if the index is above 1015.
Long-term: Long if the index is above 960.
Threats to the economic recovery
The recovery faces several obstacles: persistently high unemployment; rising long-term interest rates; huge budget and current account deficits; security threats; and high energy costs. (more)
The recovery faces several obstacles: persistently high unemployment; rising long-term interest rates; huge budget and current account deficits; security threats; and high energy costs. (more)
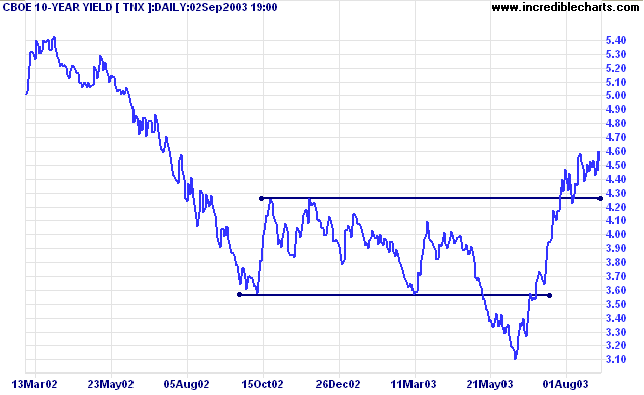
Treasury yields
After consolidating above its new support level, 10-year treasury note yield has rallied to a 1-year high of 4.60%.
The intermediate and primary trends are both up.
After consolidating above its new support level, 10-year treasury note yield has rallied to a 1-year high of 4.60%.
The intermediate and primary trends are both up.
Gold
New York (17.57): After flirting with 379, spot gold retreated to test the new support level at 371, and is currently trading at $371.20.
The primary trend is up.
Price has broken above a symmetrical triangle, with a target of 420. There is still some resistance at 382.
New York (17.57): After flirting with 379, spot gold retreated to test the new support level at 371, and is currently trading at $371.20.
The primary trend is up.
Price has broken above a symmetrical triangle, with a target of 420. There is still some resistance at 382.
ASX Australia
The All Ordinaries gained a further 12 points to close at 3224.
Continued strong volume often precedes a correction so we need to
be on the alert. Positive performance of US markets will probably
negate this.
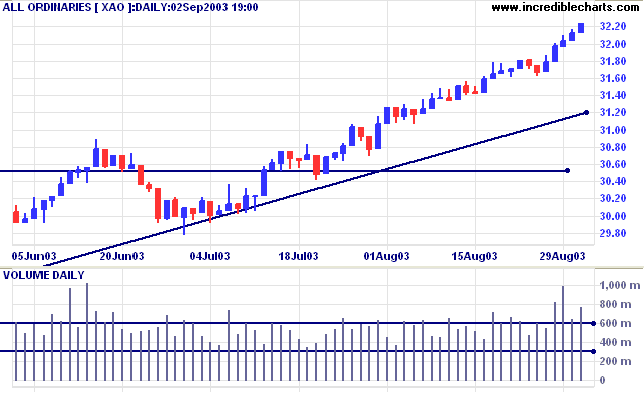
The intermediate trend and primary trend are both up.
MACD (26,12,9) is above its signal line; Slow Stochastic (20,3,3) is above;
Twiggs Money Flow signals accumulation.
MACD (26,12,9) is above its signal line; Slow Stochastic (20,3,3) is above;
Twiggs Money Flow signals accumulation.
Market Strategy
Short-term: Long above 3212. Short if the intermediate trend reverses.
Intermediate: Long if the index is above 3160.
Long-term: Long if the index is above 2978 .
Short-term: Long above 3212. Short if the intermediate trend reverses.
Intermediate: Long if the index is above 3160.
Long-term: Long if the index is above 2978 .
Financial sector
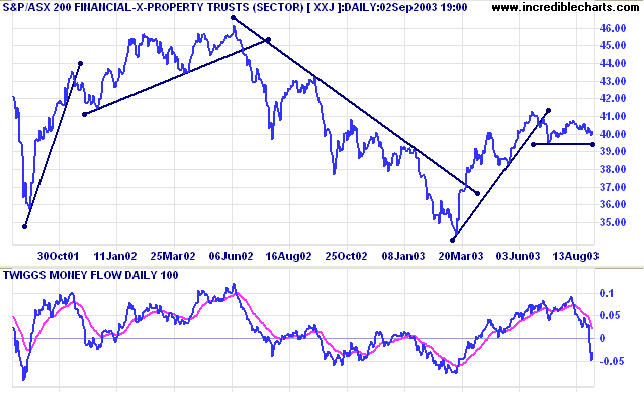
The Financial-X-Property index has broken its upward trendline after completing an inverted head and shoulders pattern. The head was quite elongated and, on reflection, may be taken as an unstable V-bottom.
Relative Strength threatens to make a new 1-year low and Twiggs Money Flow (100) has fallen sharply, signaling distribution.
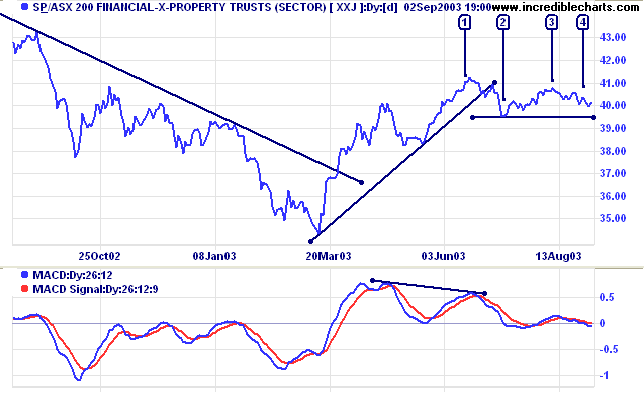
MACD completed a bearish divergence at [1] and is followed by a
lower high at [3].
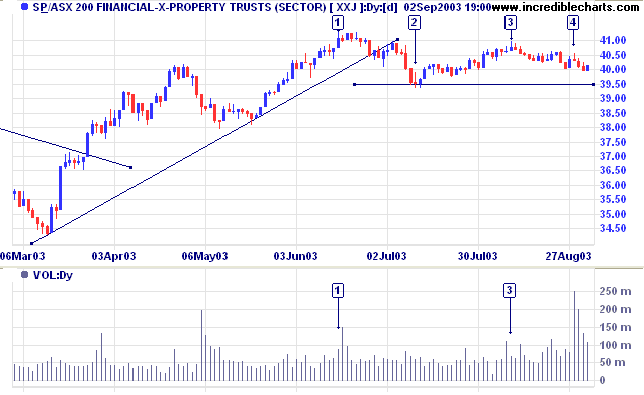
The daily volume chart displays a fall-off in volume on the rally
to [3] and a sharp rise in volume on the correction at [4].
A close below 39.50 will signal a primary trend reversal, with a likely re-test of support levels at 38.00 and 34.50; a classic V-bottom scenario.
A close below 39.50 will signal a primary trend reversal, with a likely re-test of support levels at 38.00 and 34.50; a classic V-bottom scenario.
Understanding
the Trading Diary has been expanded to offer further
assistance to readers.
Colin Twiggs
Risk comes from not knowing what you're
doing.
~ Warren Buffet
~ Warren Buffet
Searching the Diary Archives
|
To search for a stock in the Trading Diary archives,
use the normal Search function at the top of the
website page.
Example: To search for Newscorp entries in the current
year, enter +[ncp] +"back issues" in the
search field.
|
Back Issues
You can now view back issues at the Daily Trading Diary Archives.
You can now view back issues at the Daily Trading Diary Archives.
Back Issues
Access the Trading Diary Archives.

Author: Colin Twiggs is a former investment banker with almost 40 years of experience in financial markets. He co-founded Incredible Charts and writes the popular Trading Diary and Patient Investor newsletters.
Using a top-down approach, Colin identifies key macro trends in the global economy before evaluating selected opportunities using a combination of fundamental and technical analysis.
Focusing on interest rates and financial market liquidity as primary drivers of the economic cycle, he warned of the 2008/2009 and 2020 bear markets well ahead of actual events.
He founded PVT Capital (AFSL No. 546090) in May 2023, which offers investment strategy and advice to wholesale clients.