|
Incredible Charts version 4.0.2.300 is now available Check Help >> About to ensure that your version has automatically updated. To scroll through a watchlist: (1) Open the Watchlist menu; (2) Set the Active Watchlist; (3) Scroll through the watchlist using the up/down arrows on the toolbar. To select a stock from the Active Watchlist: (1) Open the Watchlist menu; (2) Place your mouse over the Active Watchlist at the bottom of the menu; (3) Select a security from the pop-up list. See Watchlists for further details. |
Trading Diary
August 22, 2003
The intermediate trend is up.
The primary trend is up.
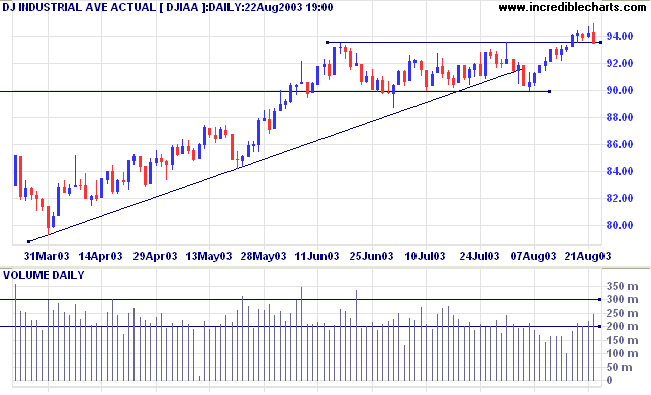
The intermediate trend is up.
The primary trend is up.
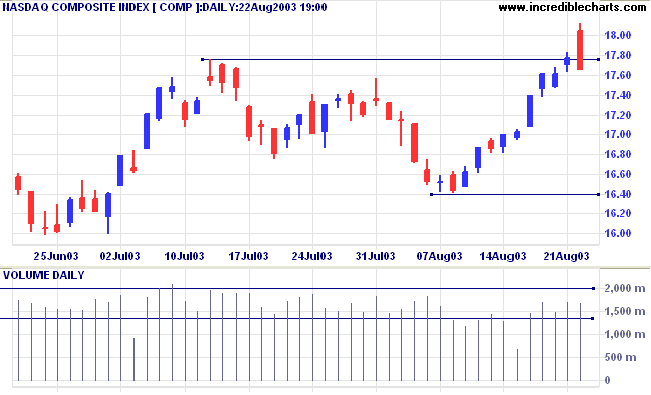
The intermediate trend is down.
The primary trend is up.
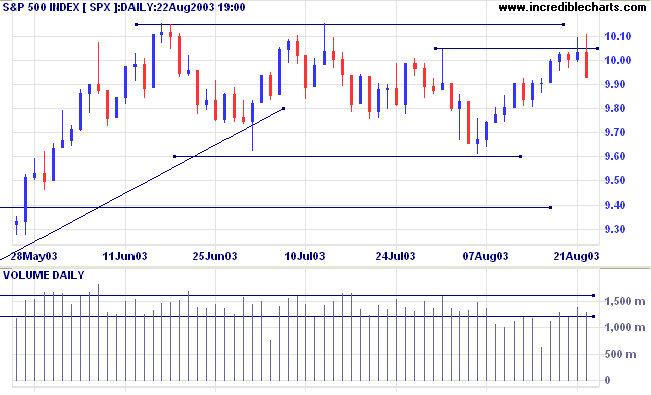
Short-term: Long if the S&P500 is above 1000. Short if below 993.
Intermediate: Long if S&P 500 is above 1015. Short if below 960.
Long-term: Long is the index is above 960.
In a bullish move, the chip-maker raised its sales guidance for the third quarter by +/- 5%. (more)
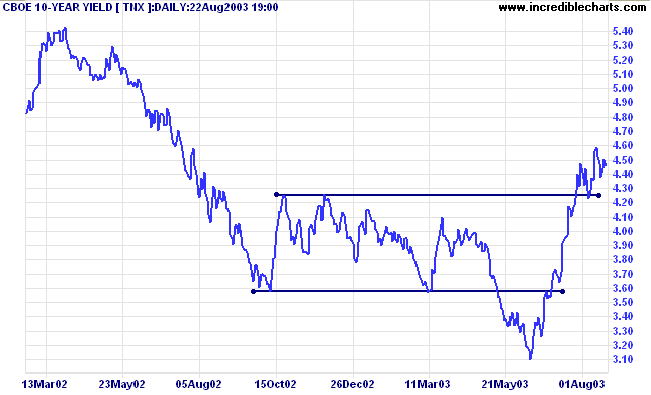
The yield on 10-year treasury notes retreated slightly to 4.46% on Friday.
The intermediate and primary trends are both up.
New York (13.30): Spot gold retreated slightly (50 cents) over the week, to close at $362.60.
The primary trend is up.
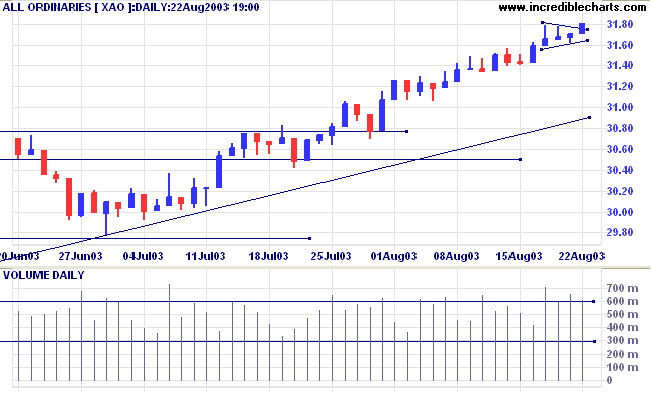
Slow Stochastic (20,3,3) whipsawed above its signal line; MACD (26,12,9) is above;
Twiggs Money Flow signals strong accumulation.
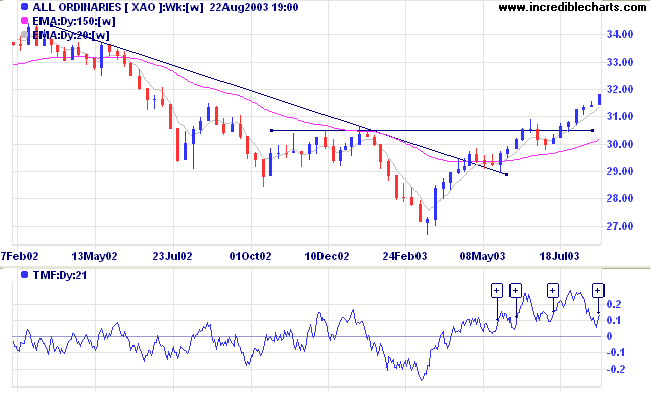
Short-term: Long if the All Ords is above 3160. Short if the intermediate trend reverses.
Intermediate: Long if the index is above 3160.
Long-term: Long if the index is above 2978 .
Changes are highlighted in bold.
- Energy [XEJ] - stage 2 (RS is rising).
- Materials [XMJ] - stage 2 (RS is rising)
- Industrials [XNJ] - stage 1 (RS is level)
- Consumer Discretionary [XDJ] - stage 2 (RS is rising)
- Consumer Staples [XSJ] - stage 1 (RS is falling)
- Health Care [XHJ] - stage 2 (RS is rising)
- Property Trusts [XPJ] - stage 2 (RS is falling)
- Financial excl. Property Trusts [XXJ] - stage 2 (RS is falling).
- Information Technology [XIJ] - stage 1 (RS is rising)
- Telecom Services [XTJ] - stage 2 (RS is rising).
- Utilities [XUJ] - stage 2 (RS is falling)
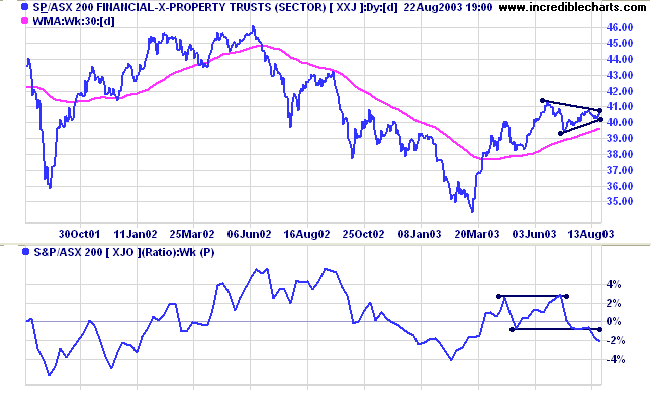
A stock screen of the ASX 200 using % Price Move (1 month: +5%) increased to 87 stocks (compared to 131 on April 11, 2003; and 8 on March 14, 2003).
- Diversified Metals & Mining (7)
- Gold (6)
- Oil & Gas Exploration & Production (4)
- Diversified Commercial (4)
- Health Care Facilities (3)
- Diversified Financial (3)
- Auto Parts & Equipment (3)
- Agricultural Products (3)
Stocks analyzed during the week were:
- Kingsgate - KCN
- Sons of Gwalia - SGW
- Great Southern Plantations - GTP
- Adelaide Brighton - ABC
- Computershare - CPU
- Challenger - CFG
Those who lament their misfortunes are
generally they who do not recognize their opportunities.
~ SA Nelson: The ABC of Stock Speculation (1903).
You can now view back issues at the Daily Trading Diary Archives.
Back Issues

Author: Colin Twiggs is a former investment banker with almost 40 years of experience in financial markets. He co-founded Incredible Charts and writes the popular Trading Diary and Patient Investor newsletters.
Using a top-down approach, Colin identifies key macro trends in the global economy before evaluating selected opportunities using a combination of fundamental and technical analysis.
Focusing on interest rates and financial market liquidity as primary drivers of the economic cycle, he warned of the 2008/2009 and 2020 bear markets well ahead of actual events.
He founded PVT Capital (AFSL No. 546090) in May 2023, which offers investment strategy and advice to wholesale clients.
