| Trading Diary Archives |
| Click the above link to view past issues of the Trading Diary. |
Trading Diary
August 1, 2003
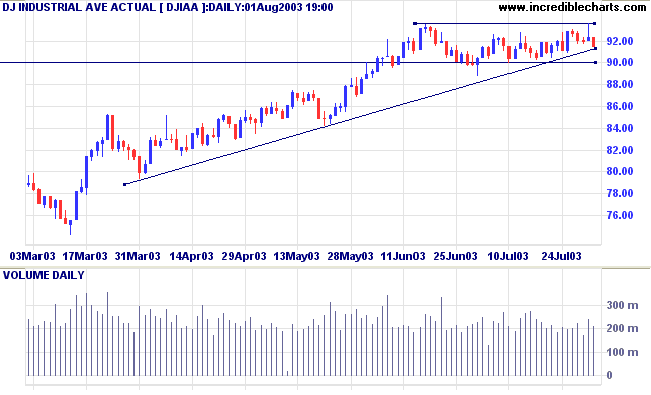
The intermediate trend is up. The index has formed a bullish ascending triangle with resistance at 9360.
The primary trend is up.
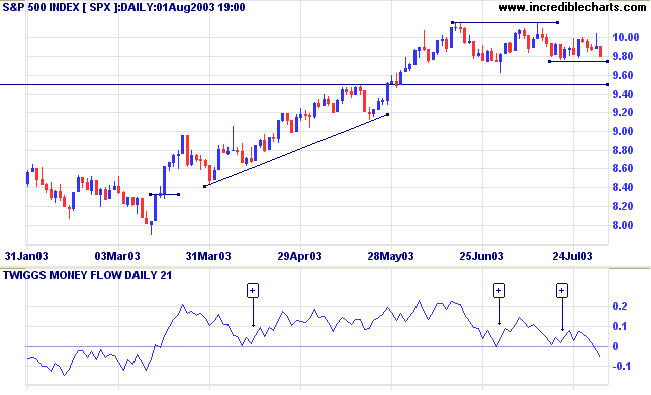
The intermediate trend is up. The index appears to be consolidating after the breakout above 950. A fall below 976 will signal an intermediate down-trend.
The primary trend is up.
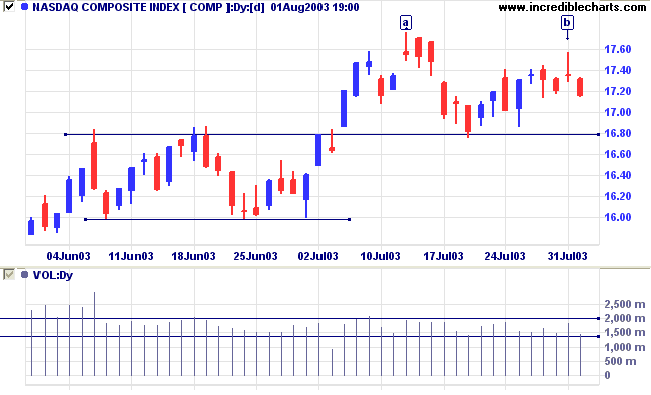
The intermediate trend is up. The index has formed a bearish lower high at [b]; a break below support at 1679 will signal a down-trend.
The primary trend is up.
Short-term: Long if the S&P500 is above 990. Short if below 976.
Intermediate: Long if S&P 500 is above 1015. Short if below 950.
Long-term: Long is the index is above 950.
Employers surprised the market, cutting 44,000 jobs in July. (more)
The Institute for Supply Management manufacturing index rose to 51.8, signaling expansion. (more)
The yield on 10-year treasury notes closed at 4.42%.
The intermediate and primary trends are both up.
New York (13.30): Spot gold fell sharply at the close, finishing the week at $346.20.
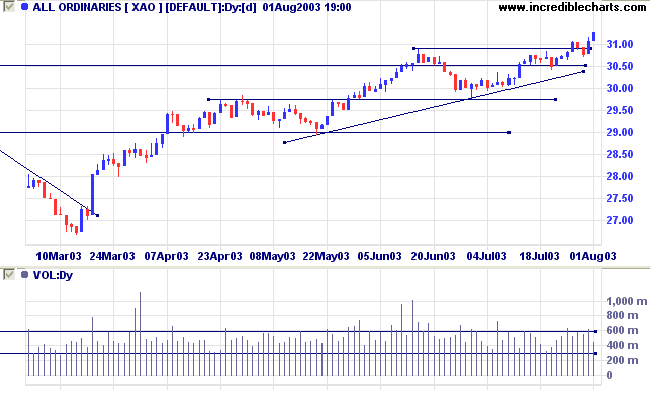
The primary trend is still upwards.
The intermediate trend is up. A fall below 2978 would signal a reversal.
The primary trend is up.
Slow Stochastic (20,3,3) has crossed back above its signal line; MACD (26,12,9) is above; Twiggs Money Flow signals accumulation.
Short-term: Long if the All Ords is above 3103. Short if the index falls below 2978.
Intermediate: Long if the index is above 3103.
Long-term: Long if the index is above 2978 .
Changes are highlighted in bold.
- Energy [XEJ] - stage 2 (RS is rising) This is an unstable V-bottom.
- Materials [XMJ] - stage 2 (RS is level)
- Industrials [XNJ] - stage 1 (RS is falling)
- Consumer Discretionary [XDJ] - stage 2 (RS is level)
- Consumer Staples [XSJ] - stage 1 (RS is falling)
- Health Care [XHJ] - stage 2 (RS is falling)
- Property Trusts [XPJ] - stage 2 (RS is falling)
- Financial excl. Property Trusts [XXJ] - stage 2 (RS is level)
- Information Technology [XIJ] - stage 1 (RS is level)
- Telecom Services [XTJ] - stage 2 (RS is rising) Another V-bottom.
- Utilities [XUJ] - stage 2 (RS is falling)
A stock screen of the ASX 200 using % Price Move (1 month: +5%) is strong at 93 stocks (compared to 131 on April 11, 2003; and 8 on March 14, 2003).
- Diversified Metals & Mining (7)
- Oil & Gas Exploration & Production (7)
- Gold (5)
- Construction Materials (4)
- Diversified Commercial Services (4)
- REITs (4)
- Diversified Financial Services (3)
- Steel (3)
- Auto Parts & Equipment (3)
Stocks analyzed during the week were:
- Wesfarmers - WES
- Gold stocks
- St George - SGB
- Burns Philp - BPC
- Adelaide Brighton - ABC
- Austal - ASB
- Henry Walker Eltin - HWE
- Smorgon Steel - SSX
- Jubilee Mines - JBM
- Caltex - CTX
If you believe you can do a thing or if you
believe you cannot - you are right.
~ Henry Ford.
| Stock Screens: MACD |
|
We have seen numerous examples of
bullish MACD troughs above zero in the last few
months: |
You can now view back issues at the Daily Trading Diary Archives.
Back Issues

Author: Colin Twiggs is a former investment banker with almost 40 years of experience in financial markets. He co-founded Incredible Charts and writes the popular Trading Diary and Patient Investor newsletters.
Using a top-down approach, Colin identifies key macro trends in the global economy before evaluating selected opportunities using a combination of fundamental and technical analysis.
Focusing on interest rates and financial market liquidity as primary drivers of the economic cycle, he warned of the 2008/2009 and 2020 bear markets well ahead of actual events.
He founded PVT Capital (AFSL No. 546090) in May 2023, which offers investment strategy and advice to wholesale clients.