Trading Diary
July 11, 2003
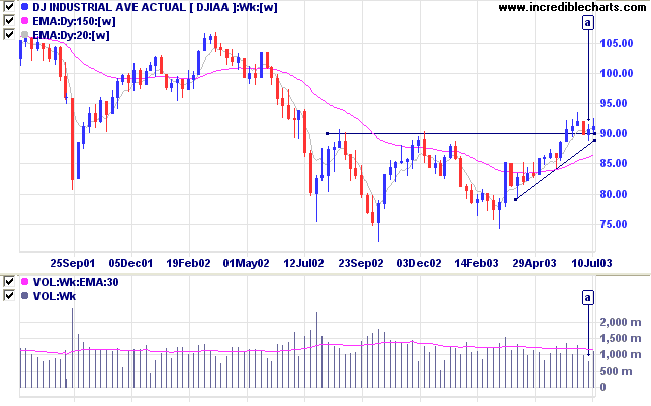
The intermediate trend is up. The index has formed a bullish symmetrical triangle above support at 9000. Volume is lower at [a] but the significance is reduced as this was a short week.
The primary trend is up.
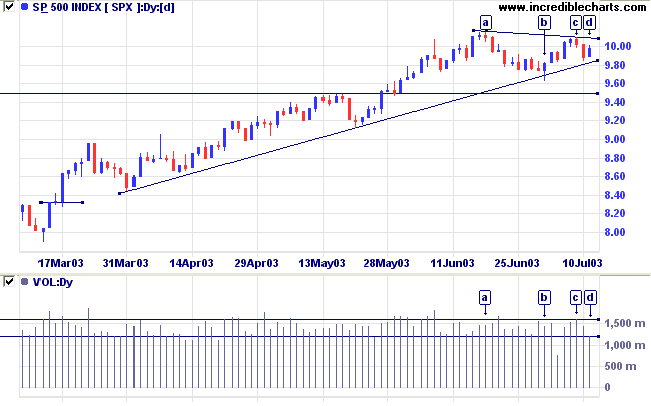
The intermediate trend is up. The index has formed a symmetrical triangle from [a] to [d], a bullish sign when it occurs above a major support level such as 950.
The primary trend is up.
The intermediate trend is up.
The primary trend is up.
The Chartcraft NYSE Bullish % Indicator is up 1.2% on last week at 76.19% (July 11).
Short-term: Long if the S&P500 is above 1010. Short if below 983.
Intermediate: Long if S&P 500 is above 1010.
Long-term: Long.
The US trade gap widens to the third highest on record, as exports disappoint despite the weak dollar. (more)
New York (13.30): Spot gold closed the week at $344.50.
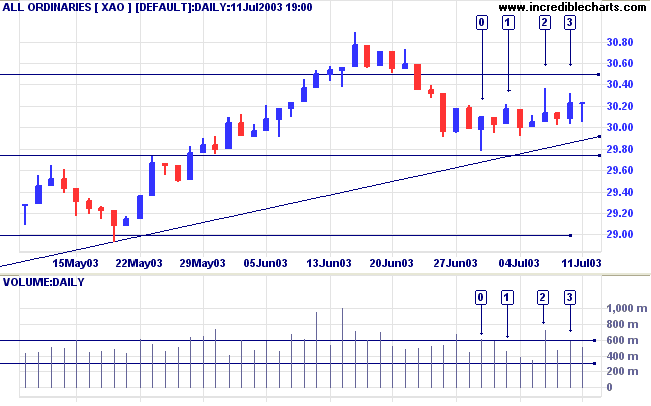
The primary trend is still upwards.
The market has shown a great deal of indecision over the past 2 weeks. Strong buying support is evident at [0] but volume dried up on the subsequent rally [1]. The next rally encountered heavy selling pressure at [2] and again at [3].
The intermediate trend is marginally up. A rally in the US should help the market to break out of the present consolidation.
The primary trend is up (marginally).
Slow Stochastic (20,3,3) is above its signal line; MACD (26,12,9) is below; Twiggs Money Flow signals accumulation.
Short-term: Long if the All Ords is above 3037. Short if the index falls below 2978.
Intermediate: Long if the index is above 3037.
Long-term: Long.
Changes are highlighted in bold.
- Energy [XEJ] - stage 2 (RS is rising) This is a V-bottom and may fall back to stage 1.
- Materials [XMJ] - stage 3 (RS is falling)
- Industrials [XNJ] - stage 1 (RS is falling)
- Consumer Discretionary [XDJ] - stage 1 (RS is level)
- Consumer Staples [XSJ] - stage 1 (RS is level) This was a V-bottom and appears to be re-entering stage 1.
- Health Care [XHJ] - stage 1 (RS is falling)
- Property Trusts [XPJ] - stage 2 (RS is level)
- Financial excl. Property Trusts [XXJ] - stage 2 (RS is level)
- Information Technology [XIJ] - stage 4 (RS is falling)
- Telecom Services [XTJ] - stage 1 (RS is level)
- Utilities [XUJ] - stage 2 (RS is falling)
A stock screen of the ASX 200 using % Price Move (1 month: +5%) is down at 49 stocks (compared to 131 on April 11, 2003; and 8 on March 14, 2003).
- Oil & Gas Exploration & Production (6)
- Diversified Metals & Mining (3)
Stocks analyzed during the week were:
- Kingsgate - KCN
- Bank of Queensland - BOQ
- Westpac - WBC
- Woodside Petroleum - WPL
- Santos - STO
- ROC Oil - ROC
There is an old saying on Wall Street
that the man who begins to speculate in stocks with the
intention of making a fortune, usually goes broke,
whereas the man who trades with a view of getting good interest
on his money, sometimes gets rich.
- S.A. Nelson: The ABC of Stock Speculation (1902).
If you have a chart open for a long time during trading hours
click on Securities>>Refresh Security From Server to receive the latest update.
Click here to access the Trading Diary Archives.
Back Issues

Author: Colin Twiggs is a former investment banker with almost 40 years of experience in financial markets. He co-founded Incredible Charts and writes the popular Trading Diary and Patient Investor newsletters.
Using a top-down approach, Colin identifies key macro trends in the global economy before evaluating selected opportunities using a combination of fundamental and technical analysis.
Focusing on interest rates and financial market liquidity as primary drivers of the economic cycle, he warned of the 2008/2009 and 2020 bear markets well ahead of actual events.
He founded PVT Capital (AFSL No. 546090) in May 2023, which offers investment strategy and advice to wholesale clients.