and the Daily Trading Diary.
Free members may have noticed that the stock screens are now performed on adjusted data.
Trading Diary
July 4, 2003
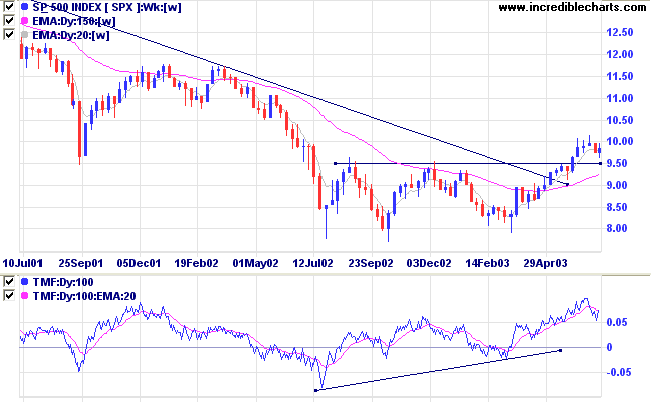
The intermediate trend is down.
The primary trend is up.
The intermediate trend has turned back up.
The primary trend is up.
The intermediate trend is up.
The primary trend is up.
The Chartcraft NYSE Bullish % Indicator is up at 74.99% (July 3).
Short-term: Long if the S&P500 is above 995.
Intermediate: Long if S&P 500 is above 995.
Long-term: Long if S&P 500 is above 1000.
The unemployment rate is up at 6.4%. New jobless claims rose to 430,000 last week. (more)
New York (03.00): Spot gold is hovering around $350.00 per ounce.
The intermediate trend is down. The next support level is at 2970.
The primary trend is up (marginally).
Slow Stochastic (20,3,3) is above its signal line; MACD (26,12,9) is below; Twiggs Money Flow signals accumulation.
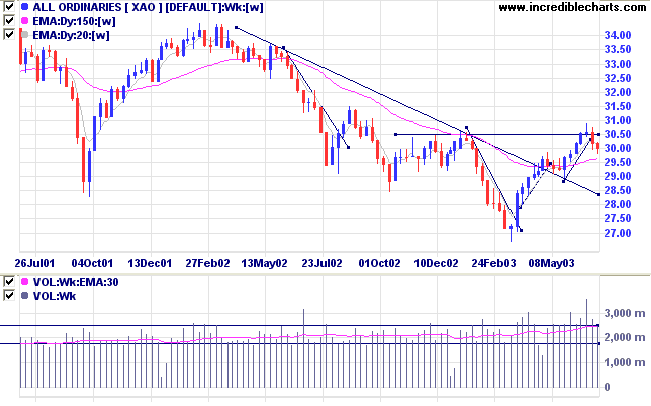
Short-term: Long if the All Ords is above 3022.
Intermediate: Long if the index is above 3022.
Long-term: Long if the index is above 3022.
Changes are highlighted in bold.
- Energy [XEJ] - stage 2 (RS is rising) This is a V-bottom and may fall back to stage 1.
- Materials [XMJ] - stage 3 (RS is falling)
- Industrials [XNJ] - stage 1 (RS is falling)
- Consumer Discretionary [XDJ] - stage 1 (RS is level)
- Consumer Staples [XSJ] - stage 2 (RS is rising)
- Health Care [XHJ] - stage 4 (RS is falling)
- Property Trusts [XPJ] - stage 2 (RS is level)
- Financial excl. Property Trusts [XXJ] - stage 2 (RS is rising)
- Information Technology [XIJ] - stage 4 (RS is falling)
- Telecom Services [XTJ] - stage 4 (RS is level)
- Utilities [XUJ] - stage 2 (RS is level)
A stock screen of the ASX 200 using % Price Move (1 month: +5%) is up at 58 stocks (compared to 131 on April 11, 2003; and 8 on March 14, 2003).
- Oil & Gas Exploration & Production (6)
- Diversified Financial (4)
- Construction Materials (4)
- Diversified Metals & Mining (3)
- Casinos & Gaming (3)
- Agricultural Products (3)
- Gold (3)
Stocks analyzed during the week were:
- ANZ Bank - ANZ
- Woodside Petroleum - WPL
- Burswood - BIR
- Seven Network - SEV
The prerequisites of success:
First, is a soundly based self-confidence,......
Second is self-motivation and commitment,....
Third is intellectual independence,........
Fourth is a fundamental personal honesty,.....
And finally is a sincere love of what you do,......
- Victor Sperandeo, Trader Vic - Methods of a Wall Street
Master.
When there are a number of indicators below the price chart,
the slots are blanked out as they are too small to be legible.
If you have a larger screen and want to display more indicator slots,
change the default setting at View>>Visible Indicator Slots.
Click here to access the Trading Diary Archives.
Back Issues

Author: Colin Twiggs is a former investment banker with almost 40 years of experience in financial markets. He co-founded Incredible Charts and writes the popular Trading Diary and Patient Investor newsletters.
Using a top-down approach, Colin identifies key macro trends in the global economy before evaluating selected opportunities using a combination of fundamental and technical analysis.
Focusing on interest rates and financial market liquidity as primary drivers of the economic cycle, he warned of the 2008/2009 and 2020 bear markets well ahead of actual events.
He founded PVT Capital (AFSL No. 546090) in May 2023, which offers investment strategy and advice to wholesale clients.