If you have not already done so, open the View menu
and select Hide Top Advert and Hide Right Buttons.
Trading Diary
July 3, 2003
The Dow formed an inside day, closing at 1.00 p.m. down 0.8% at 9070.
The intermediate trend is still down. Tuesday's false break, below support at 8900, is a bullish sign.
The primary trend is up.

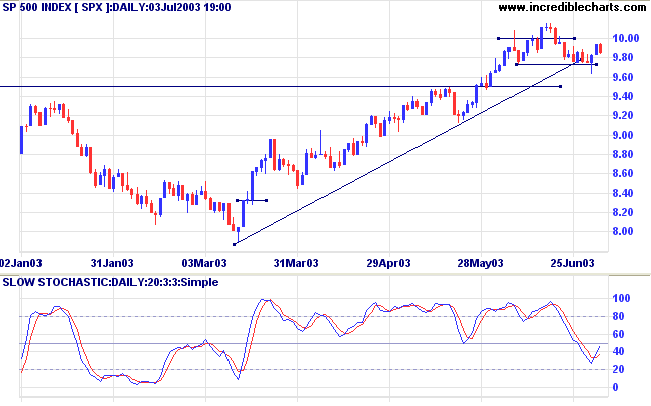
The intermediate trend has turned up. Tuesday's false break, below support at 972, is a bullish sign.
The primary trend is up.
The intermediate trend is up. A rise above 1686 will complete a bullish double bottom pattern.
The primary trend is up.
Intermediate: Long if the S&P is above 995.
Long-term: Long.
The unemployment level rose to 6.4% in June, from 6.1% in May; the highest level in 9 years. (more)
US markets closed 1.00 p.m. Thursday ahead of Friday, Fourth of July holiday.
New York (13.00): Spot gold closed at $US 350.20.
On the five-year chart gold is above the long-term upward trendline.
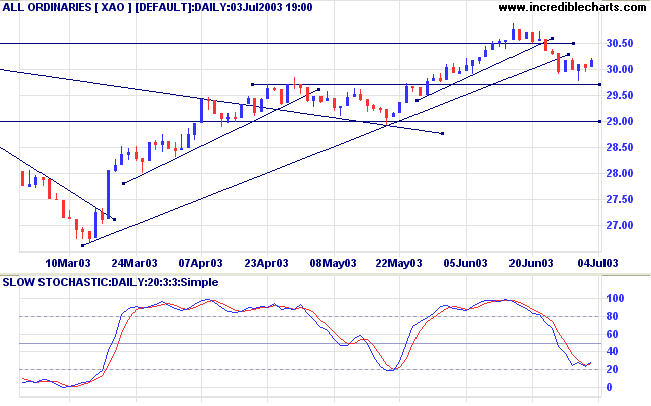
The intermediate trend is still down.
The primary trend is up.

Intermediate: The primary trend has reversed up; Long if the All Ords is above 3022.
Long-term: Long.
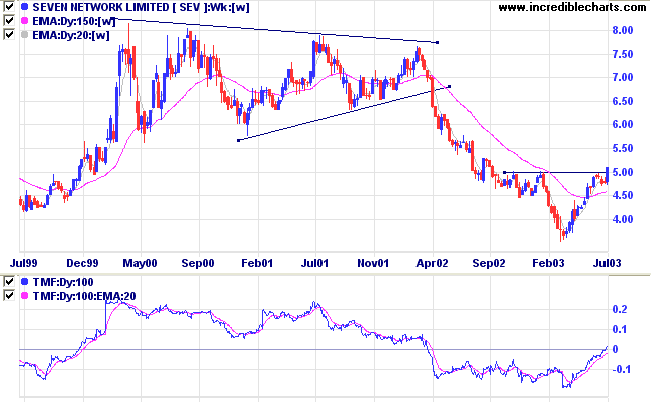
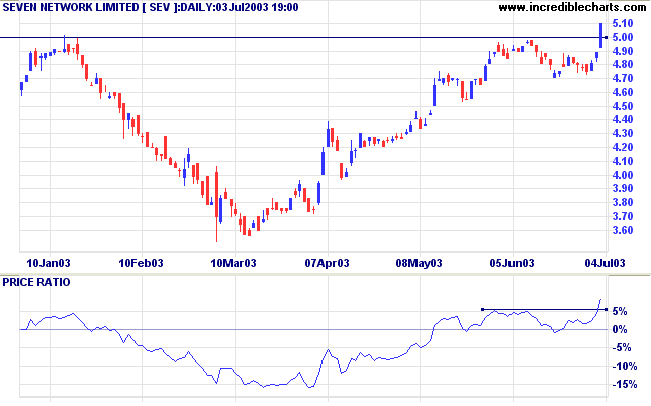
SEV completed a V-bottom with a break above resistance at 5.00.
The pattern is fragile and prone to failure.
Twiggs Money Flow (100) signals accumulation..


A fall below 4.70 would be bearish.
~ Helen Keller.
Most breakouts and reversal patterns are accompanied by a bar with a larger than normal range.
Jack Schwager compares daily range to the average true range;
values greater than 2.0 normally signal a wide-ranging day.
Back Issues

Author: Colin Twiggs is a former investment banker with almost 40 years of experience in financial markets. He co-founded Incredible Charts and writes the popular Trading Diary and Patient Investor newsletters.
Using a top-down approach, Colin identifies key macro trends in the global economy before evaluating selected opportunities using a combination of fundamental and technical analysis.
Focusing on interest rates and financial market liquidity as primary drivers of the economic cycle, he warned of the 2008/2009 and 2020 bear markets well ahead of actual events.
He founded PVT Capital (AFSL No. 546090) in May 2023, which offers investment strategy and advice to wholesale clients.
