Chart Time Stamp
We received the 4.00 p.m. ASX update late yesterday.
Please always check the time stamp on the chart (remove the legend to display this).
If the time stamp appears incorrect, select Securities>>Refresh Security From Server.
We received the 4.00 p.m. ASX update late yesterday.
Please always check the time stamp on the chart (remove the legend to display this).
If the time stamp appears incorrect, select Securities>>Refresh Security From Server.
Trading Diary
June 30, 2003
These extracts from my daily trading diary are
intended to illustrate the techniques used in short-term trading
and should not be interpreted as investment advice. Full terms
and conditions can be found at Terms
of Use .
USA
The Dow formed an inside day, closing almost unchanged at 8985 on higher volume.
The intermediate trend is down.
The primary up-trend is up.
The Dow formed an inside day, closing almost unchanged at 8985 on higher volume.
The intermediate trend is down.
The primary up-trend is up.
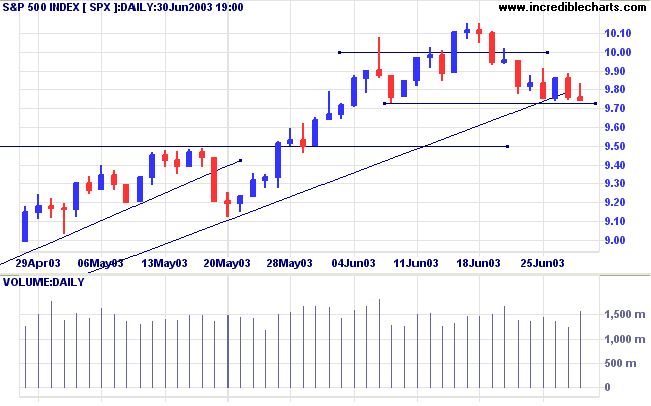
The S&P 500 closed 2 points lower at 974.
The intermediate trend is down. The index may be forming equal lows above 972; a bullish sign in an up-trend.
The primary trend is up.
The intermediate trend is down. The index may be forming equal lows above 972; a bullish sign in an up-trend.
The primary trend is up.
The Nasdaq Composite eased 0.2% to close at 1622.
The intermediate trend is up. Equal lows on the 9th and 24th of June are a bullish sign.
The primary trend is up.
The intermediate trend is up. Equal lows on the 9th and 24th of June are a bullish sign.
The primary trend is up.
The Chartcraft NYSE Bullish % Indicator is 0.66%
from its peak, at 74.56% on June 27.
Market Strategy
Short-term: Long if the S&P 500 is above 992 (Wednesday's
high).
Intermediate: Long if the S&P is above 992.
Long-term: Long.
Intermediate: Long if the S&P is above 992.
Long-term: Long.
Flat end to the quarter
The quarter ended with some profit-taking on Monday. (more)
The quarter ended with some profit-taking on Monday. (more)
Short week ahead
US markets will close 1.00 p.m. Thursday ahead of Friday, Fourth of July holiday.
US markets will close 1.00 p.m. Thursday ahead of Friday, Fourth of July holiday.
Gold
New York (17.50): Spot gold rose slightly to $US 346.30.
On the five-year chart gold is still above the long-term upward trendline.
New York (17.50): Spot gold rose slightly to $US 346.30.
On the five-year chart gold is still above the long-term upward trendline.
ASX Australia
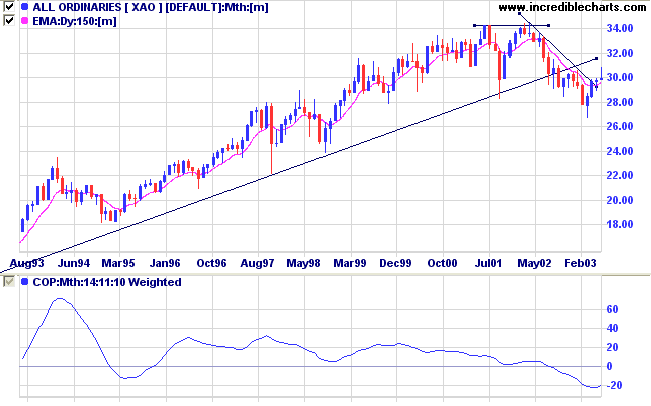
The monthly Coppock indicator still slopes up below zero,
signaling the start of a bull market.
Twiggs Money Flow (100) signals accumulation.
Recent months display a distinct V-bottom and we may see a re-test of support levels before a real bull market develops.
Twiggs Money Flow (100) signals accumulation.
Recent months display a distinct V-bottom and we may see a re-test of support levels before a real bull market develops.
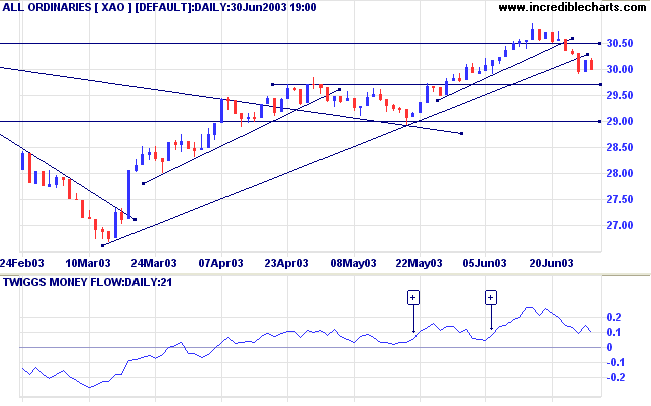
The All Ordinaries rallied weakly before closing 19 points lower
at 2999. Lower volume indicates that the correction may be
slowing.
The intermediate trend is down.
The primary trend is up. If price holds above support at 2970 this will indicate that the up-trend is still strong. A fall to 2900 will signal weakness.
The intermediate trend is down.
The primary trend is up. If price holds above support at 2970 this will indicate that the up-trend is still strong. A fall to 2900 will signal weakness.
Market Strategy
Short-term: Long if the All Ords is above 3032 (Thursday's
high).
Intermediate: The primary trend has reversed up; Long if the All Ords is above 3050.
Long-term: The primary trend reversal has confirmed the March 18 follow through signal. Long.
Intermediate: The primary trend has reversed up; Long if the All Ords is above 3050.
Long-term: The primary trend reversal has confirmed the March 18 follow through signal. Long.
ANZ Bank [ANZ]
Banks like ANZ tend to form support and resistance at round numbers like 16.00, 17.00, 18.00, 19.00 and 20.00.
After testing resistance at 19.00 the bank appears headed for a re-test of support at 18.00.
Twiggs Money Flow signals accumulation, while MACD has crossed below its signal line but is still above zero.
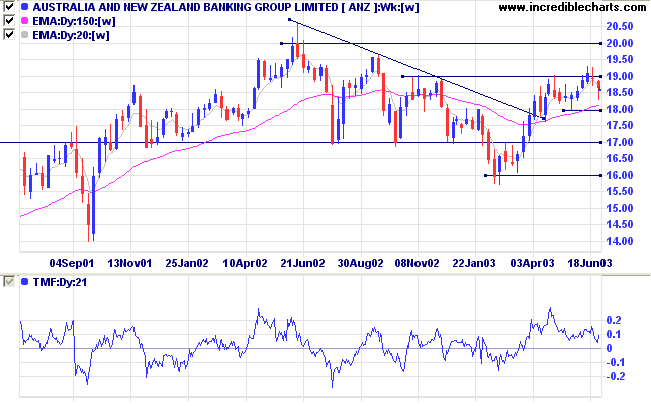
Relative Strength (price ratio: xao) has leveled out but is
holding above the April low; a good sign.
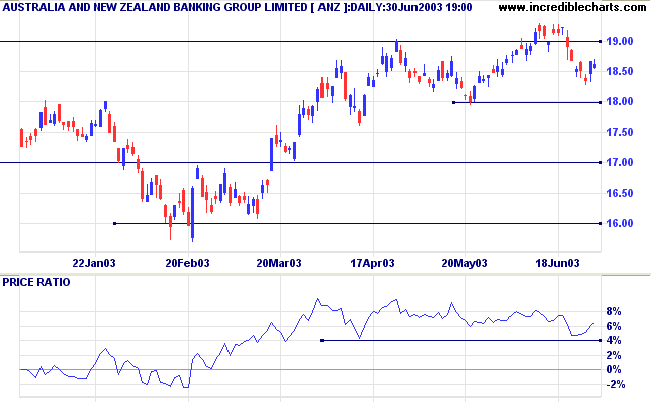
A dry-up of volume and daily range at the support level may
present entry opportunities for short-term traders.
A rise above 19.30 may present long-term opportunities. Conservative traders will wait for a break-out above 19.00 and then a pull-back that respects that level.
A close below 18.00 would be bearish.
A rise above 19.30 may present long-term opportunities. Conservative traders will wait for a break-out above 19.00 and then a pull-back that respects that level.
A close below 18.00 would be bearish.
Understanding
the Trading Diary has been expanded to offer further
assistance to readers.
Colin Twiggs
The world is round and the place which may seem like the end may
also be only the beginning.
~ Ivy Baker Priest.
~ Ivy Baker Priest.
Time Periods
For faster chart loading select Time Period>>Chart 3 Years Data.
To load all available data select Time Period>>Chart Complete Data.
For faster chart loading select Time Period>>Chart 3 Years Data.
To load all available data select Time Period>>Chart Complete Data.
Back Issues
Access the Trading Diary Archives.

Author: Colin Twiggs is a former investment banker with almost 40 years of experience in financial markets. He co-founded Incredible Charts and writes the popular Trading Diary and Patient Investor newsletters.
Using a top-down approach, Colin identifies key macro trends in the global economy before evaluating selected opportunities using a combination of fundamental and technical analysis.
Focusing on interest rates and financial market liquidity as primary drivers of the economic cycle, he warned of the 2008/2009 and 2020 bear markets well ahead of actual events.
He founded PVT Capital (AFSL No. 546090) in May 2023, which offers investment strategy and advice to wholesale clients.