The new Premium version includes
hourly ASX updates, US indexes and the Daily Trading Diary.
Subscribe for only
$270 (AUD)
Trading Diary
June 20, 2003
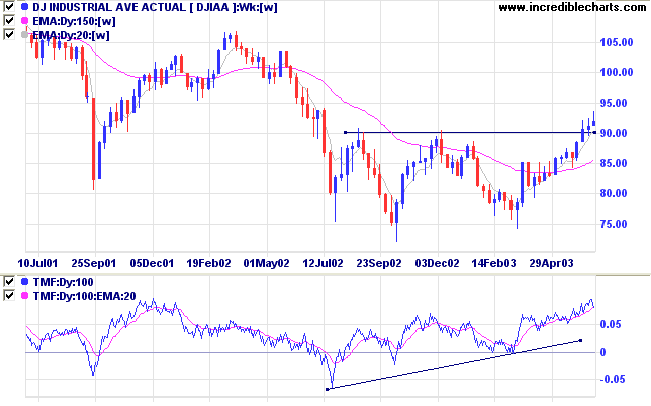
The Dow formed a weak close at 9201 on strong volume; and we may see a re-test of the new 9000 support level. The index is up 0.9% on last week's close.
The intermediate trend is up.
The primary up-trend is up.

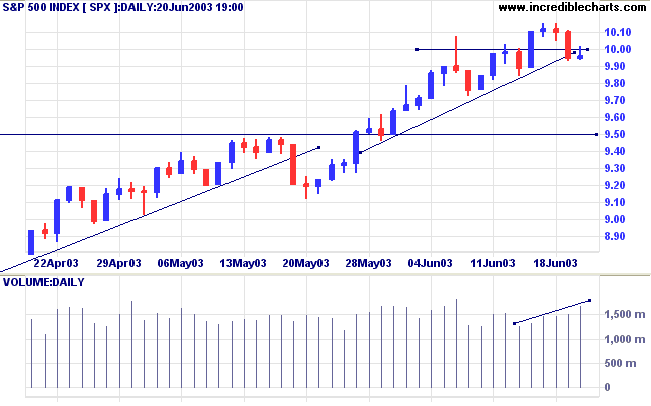
The intermediate trend is up. The broken trendline and closes below the support level indicate weakness.
The primary trend is up, with the index having broken above 950.

The intermediate trend is up.
The index is in a primary up-trend.
Intermediate: Long if the S&P is above 1002.
Long-term: Long above 1002.
New York (13.30): Spot gold closed slightly down on last week at $US 356.10.
On the five-year chart gold is above the long-term upward trendline.
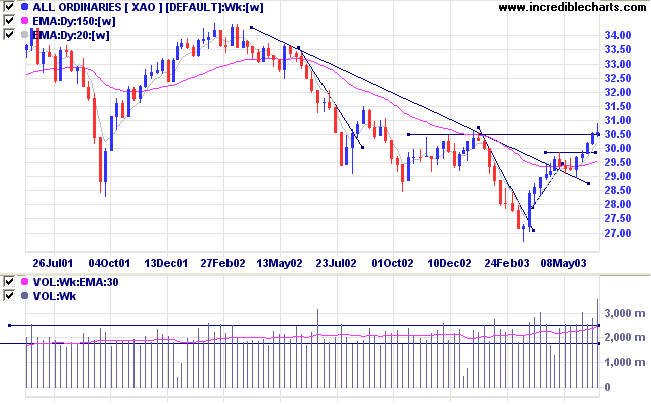
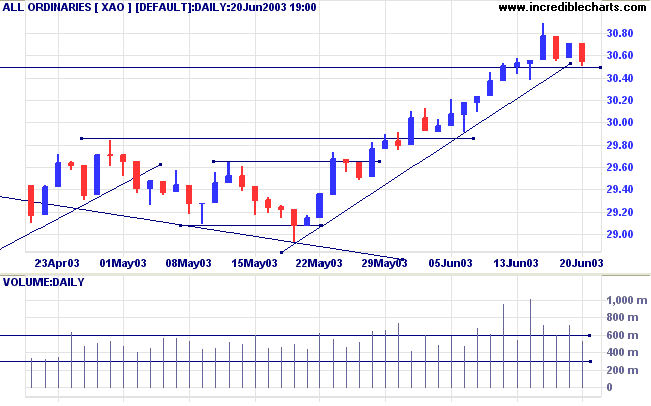
The intermediate trend is up. The trendline has been broken but on encouragingly lower volume.
The primary trend has started an up-trend.

Twiggs Money Flow (100) signals accumulation.
MACD (26,12,9) is above its signal line and has completed a bullish trough above zero; Slow Stochastic (20,3,3) is above its signal line; and Twiggs Money Flow (21) signals accumulation.

Intermediate: Long if the All Ords is above 3050. The primary trend has turned upwards.
Long-term: Long if the All Ords is above 3050. The primary trend reversal has confirmed the follow through bull signal from March 18.
Changes are highlighted in bold.
- Energy [XEJ] - stage 1 (RS is level)
- Materials [XMJ] - stage 3 (RS is falling)
- Industrials [XNJ] - stage 1 (RS is falling)
- Consumer Discretionary [XDJ] - stage 1 (RS is level)
- Consumer Staples [XSJ] - stage 2 (RS is rising)
- Health Care [XHJ] - stage 4 (RS is falling)
- Property Trusts [XPJ] - stage 2 (RS is rising)
- Financial excl. Property Trusts [XXJ] - stage 2 (RS is rising)
- Information Technology [XIJ] - stage 4 (RS is falling)
- Telecom Services [XTJ] - stage 4 (RS is level)
- Utilities [XUJ] - stage 2 (RS is rising)
A stock screen of the ASX 200 using % Price Move (1 month: +5%) is up at 78 stocks (compared to 131 on April 11, 2003; and 8 on March 14, 2003).
- REITs (10)
- Banks (7)
- Diversified Financial (5)
- Diversified Metals & Mining (5)
- Steel (3)
- Construction Materials (3)
- Agricultural Products (3)
Stocks analyzed during the week were:
- Computershare - CPU
- Chemeq - CMQ
- Kingsgate - KCN
- Bank of Queensland - BOQ
- Caltex - CTX
- Harvey Norman - HVN
To understand yourself is to be wise;
To conquer others is to have strength;
To conquer yourself is to be strong.
To know when you have enough is to be rich.
- Lao Tse.
The Weekly Review will be mailed at around 2.00 p.m. Saturday, in future.
Back Issues

Author: Colin Twiggs is a former investment banker with almost 40 years of experience in financial markets. He co-founded Incredible Charts and writes the popular Trading Diary and Patient Investor newsletters.
Using a top-down approach, Colin identifies key macro trends in the global economy before evaluating selected opportunities using a combination of fundamental and technical analysis.
Focusing on interest rates and financial market liquidity as primary drivers of the economic cycle, he warned of the 2008/2009 and 2020 bear markets well ahead of actual events.
He founded PVT Capital (AFSL No. 546090) in May 2023, which offers investment strategy and advice to wholesale clients.
