
Use the up/down arrows on the toolbar
to scroll through the charts on your watchlist.
Trading Diary
June 19, 2003
These extracts from my daily trading diary are
intended to illustrate the techniques used in short-term trading
and should not be interpreted as investment advice. Full terms
and conditions can be found at Terms
of Use .
USA
The Dow fell 1.2% to 9179, on encouragingly lower volume. The index appears to be headed for a re-test of the 9000 support level.
The intermediate trend is up.
The primary up-trend is up.
The Dow fell 1.2% to 9179, on encouragingly lower volume. The index appears to be headed for a re-test of the 9000 support level.
The intermediate trend is up.
The primary up-trend is up.
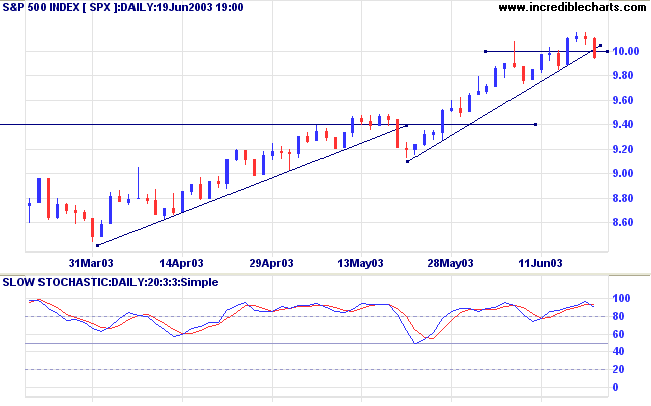
The S&P 500 closed below the 1000 support level, 1.5% down at
994.
The intermediate trend is up. The break of the trendline and support level signals weakness.
The primary trend is up.
The intermediate trend is up. The break of the trendline and support level signals weakness.
The primary trend is up.
The Nasdaq Composite fell 1.7% to close at 1648.
The intermediate trend is up.
The index is in a primary up-trend.
The intermediate trend is up.
The index is in a primary up-trend.
The Chartcraft NYSE Bullish % Indicator eased
slightly to 74.94% on June 18.
Market Strategy
Short-term: Long if the S&P 500 is above 1011.
Intermediate: Long if the S&P is above 1011.
Long-term: Long.
Intermediate: Long if the S&P is above 1011.
Long-term: Long.
"Triple Witching" tomorrow
There was more profit-taking ahead of Friday's triple-witching hour.
There was more profit-taking ahead of Friday's triple-witching hour.
Jobless claims
New jobless claims fell to 421,000 for the week ended June 14th, but are still well above the key 400,000 level, which indicates rising unemployment. (more)
New jobless claims fell to 421,000 for the week ended June 14th, but are still well above the key 400,000 level, which indicates rising unemployment. (more)
Gold
New York (17.27): Spot gold recovered to $US 361.80.
On the five-year chart gold is above the long-term upward trendline.
New York (17.27): Spot gold recovered to $US 361.80.
On the five-year chart gold is above the long-term upward trendline.
ASX Australia
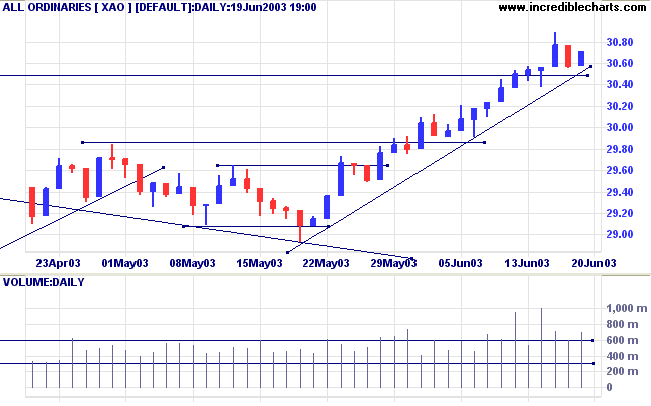
The All Ordinaries formed an inside day on strong volume; closing
up 13 points at 3071. A
pennant pattern in an up-trend (especially when formed above
a key support level) would normally signal continuation, but
volume has not dried up as expected. There may still be a further
re-test of the 3050 support level.
The intermediate trend is up.
The primary trend is up.
The monthly Coppock indicator has turned up below zero, signaling the start of a bull market.
Twiggs Money Flow (100) signals accumulation.
MACD (26,12,9) is above its signal line; Slow Stochastic (20,3,3) is below; and Twiggs Money Flow (21) signals accumulation, having completed two bullish troughs above zero.
Market Strategy
Short-term: Long if the All Ords is above 3071.
Intermediate: The primary trend has reversed up; Long if the All Ords is above 3071.
Long-term: The primary trend reversal has confirmed the March 18 follow through signal. Long.
Intermediate: The primary trend has reversed up; Long if the All Ords is above 3071.
Long-term: The primary trend reversal has confirmed the March 18 follow through signal. Long.
Bank of Queensland [BOQ]
BOQ has broken out below the flag pattern on higher volume.
Twiggs Money Flow (21-day) signals distribution; MACD (26,12,9) is below its signal line.
Relative Strength (price ratio: xao) continues to fall, from its peak at the start of June.
BOQ has broken out below the flag pattern on higher volume.
Twiggs Money Flow (21-day) signals distribution; MACD (26,12,9) is below its signal line.
Relative Strength (price ratio: xao) continues to fall, from its peak at the start of June.
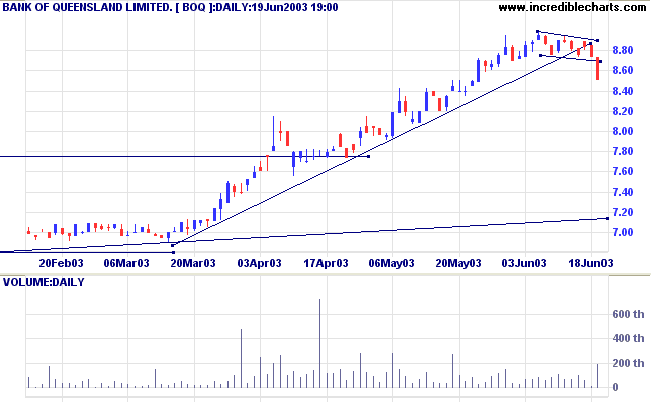
Some traders may have taken short positions on the break below
the
flag pattern; the target would be the primary trendline at
7.20.
With an overall bullish market this position is fairly risky and they will need to protect against a bear trap - where price reverses back above the flag and resumes the up-trend.
A fall below 8.50 (the latest low) will be bearish
A rise above 8.73 (the high of latest bar) would signal uncertainty.
A rise above the upper border of the flag will be a bull signal.
Harvey Norman [HVN]
HVN has rallied above the long-term downward trendline and formed a V-bottom.
Twiggs Money Flow (100-day) has edged back above zero, to signal accumulation.
Relative Strength (price ratio: xao) is rising.
HVN has rallied above the long-term downward trendline and formed a V-bottom.
Twiggs Money Flow (100-day) has edged back above zero, to signal accumulation.
Relative Strength (price ratio: xao) is rising.
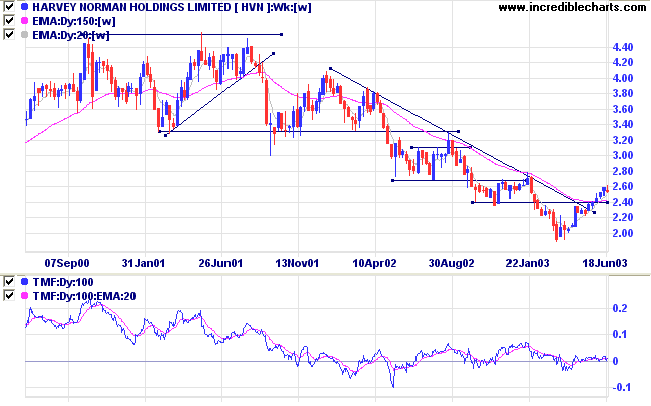
Overhead resistance is at 2.70.
MACD (26,12,9) shows a bullish divergence at [D].
MACD (26,12,9) shows a bullish divergence at [D].
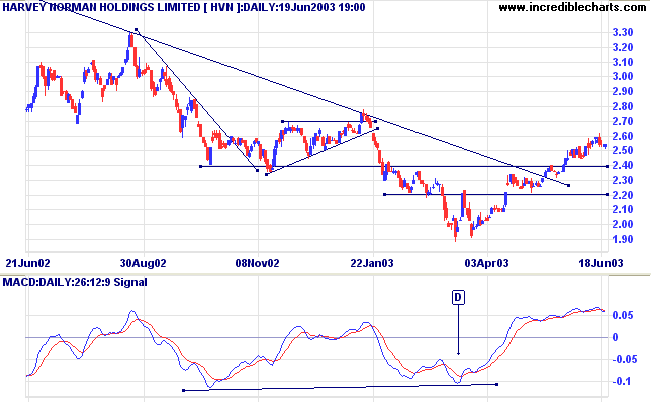
V-bottoms normally lead to a re-test of support levels. In the
current bull market this may mean a correction back to 2.20 or
2.40.
Volume has been lower in recent weeks, reinforcing the likelihood of a pull-back.
Opportunities to go long may present themselves if volume and volatility dry up at the support levels, during a pull-back.
A fall below 2.20 would be bearish.
Volume has been lower in recent weeks, reinforcing the likelihood of a pull-back.
Opportunities to go long may present themselves if volume and volatility dry up at the support levels, during a pull-back.
A fall below 2.20 would be bearish.
Understanding
the Trading Diary has been expanded to offer further
assistance to readers.
Colin Twiggs
Genius is only the power of making continuous
efforts.
The line between failure and success is so fine
that we scarcely know when we pass it;
so fine that we are often on the line and do not know it.
~ Elbert Hubbard (1856 - 1915).
The line between failure and success is so fine
that we scarcely know when we pass it;
so fine that we are often on the line and do not know it.
~ Elbert Hubbard (1856 - 1915).
Back Issues
Click here to access the Daily Trading Diary Archives.
Click here to access the Daily Trading Diary Archives.
Back Issues
Access the Trading Diary Archives.

Author: Colin Twiggs is a former investment banker with almost 40 years of experience in financial markets. He co-founded Incredible Charts and writes the popular Trading Diary and Patient Investor newsletters.
Using a top-down approach, Colin identifies key macro trends in the global economy before evaluating selected opportunities using a combination of fundamental and technical analysis.
Focusing on interest rates and financial market liquidity as primary drivers of the economic cycle, he warned of the 2008/2009 and 2020 bear markets well ahead of actual events.
He founded PVT Capital (AFSL No. 546090) in May 2023, which offers investment strategy and advice to wholesale clients.