US Indexes
Apologies for the delays.
Our technical team is working on the problem.
Apologies for the delays.
Our technical team is working on the problem.
Trading Diary
June 18, 2003
These extracts from my daily trading diary are
intended to illustrate the techniques used in short-term trading
and should not be interpreted as investment advice. Full terms
and conditions can be found at Terms
of Use .
USA
The Dow retreated 0.3% to 9293 on average volume, signaling continued uncertainty.
The intermediate trend is up.
The primary up-trend is up.
The Dow retreated 0.3% to 9293 on average volume, signaling continued uncertainty.
The intermediate trend is up.
The primary up-trend is up.
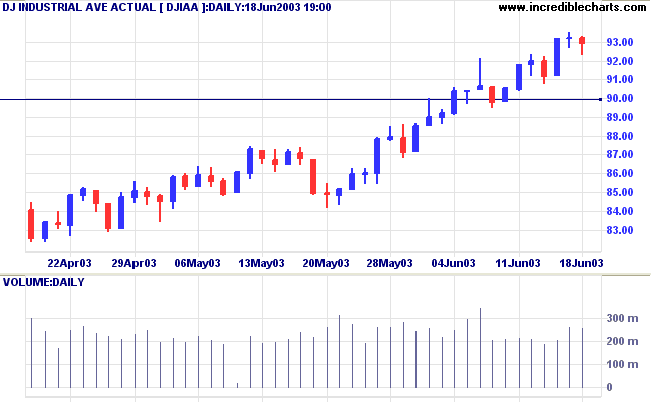
The S&P 500 lost 1 point to close at 1010.
The intermediate trend is up.
The primary trend is up.
The intermediate trend is up.
The primary trend is up.
The Nasdaq Composite rallied 0.5% to close at 1677, testing the
recent high.
The intermediate trend is up.
The index is in a primary up-trend.
The intermediate trend is up.
The index is in a primary up-trend.
The Chartcraft NYSE Bullish % Indicator increased
to 75.04% on June 17.
Market Strategy
Short-term: Long if the S&P 500 is above 1000.
Intermediate: Long if the S&P is above 1000.
Long-term: Long - the S&P 500 primary trend has turned upwards after two bull signals: the March 17 follow through day and the April 3 NYSE Bullish % signal.
Intermediate: Long if the S&P is above 1000.
Long-term: Long - the S&P 500 primary trend has turned upwards after two bull signals: the March 17 follow through day and the April 3 NYSE Bullish % signal.
Eastman Kodak
The photographic film-maker halved its' second-quarter earnings forecasts, blaming SARS for slow sales in Asia. (more)
The photographic film-maker halved its' second-quarter earnings forecasts, blaming SARS for slow sales in Asia. (more)
Gold
New York (17.46): Spot gold eased to $US 357.20.
On the five-year chart gold is above the long-term upward trendline.
New York (17.46): Spot gold eased to $US 357.20.
On the five-year chart gold is above the long-term upward trendline.
ASX Australia
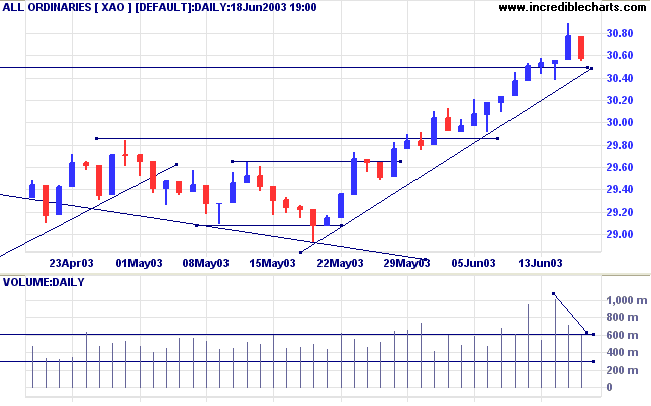
The All Ordinaries retreated 19 points to close at 3058 on lower
volume. The index appears headed for a re-test of support at
3050.
The intermediate trend is up.
The primary trend is up.
The monthly Coppock indicator has turned up below zero, signaling the start of a bull market.
Twiggs Money Flow (100) signals accumulation.
MACD (26,12,9) is above its signal line; Slow Stochastic (20,3,3) has crossed to below; and Twiggs Money Flow (21) signals accumulation, having completed two bullish troughs above zero.
Market Strategy
Short-term: Long if the All Ords is above 3050.
Intermediate: The primary trend has reversed up; Long if the All Ords is above 3050.
Long-term: The primary trend reversal has confirmed the March 18 follow through signal. Long if the All Ords is above 3050.
Intermediate: The primary trend has reversed up; Long if the All Ords is above 3050.
Long-term: The primary trend reversal has confirmed the March 18 follow through signal. Long if the All Ords is above 3050.
Bank of Queensland [BOQ]
BOQ is in a fast upward trend but has broken the intermediate trendline - twice in the past few days.
Twiggs Money Flow (100-day and 21-day) is neutral; MACD (26,12,9) has crossed below its signal line.
Relative Strength (price ratio: xao) has declined from its peak at the start of June.
BOQ is in a fast upward trend but has broken the intermediate trendline - twice in the past few days.
Twiggs Money Flow (100-day and 21-day) is neutral; MACD (26,12,9) has crossed below its signal line.
Relative Strength (price ratio: xao) has declined from its peak at the start of June.
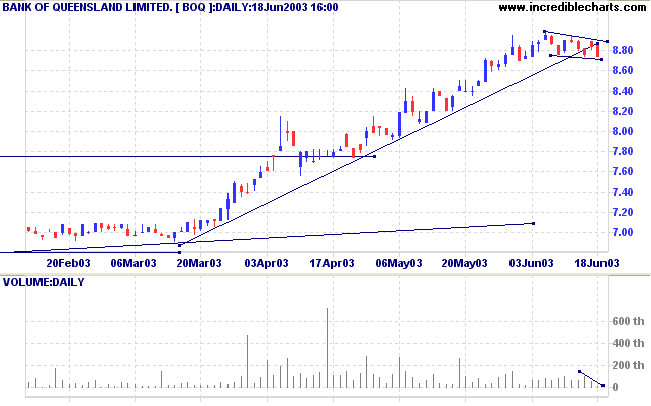
The trendline break is in the form of a
flag pattern, normally a continuation signal.
Volume has dried up on the latest down-swing, signaling the likelihood of an upward breakout.
A break above the upper border of the flag will be a bullish signal; and may present short-term traders an opportunity to increase their long position.
A break below the lower border of the flag will be bearish and may signal a return to the primary trendline.
Caltex [CTX]
Caltex is consolidating after a fast rally, from [b].
The previous two rallies were both followed by periods of sideways consolidation, rather than a sharp correction back to the primary trendline.
Twiggs Money Flow (100-day and 21-day) signal strong accumulation; MACD (26,12,9) has declined but is still above zero.
Relative Strength (price ratio: xao) has declined from its May peak.
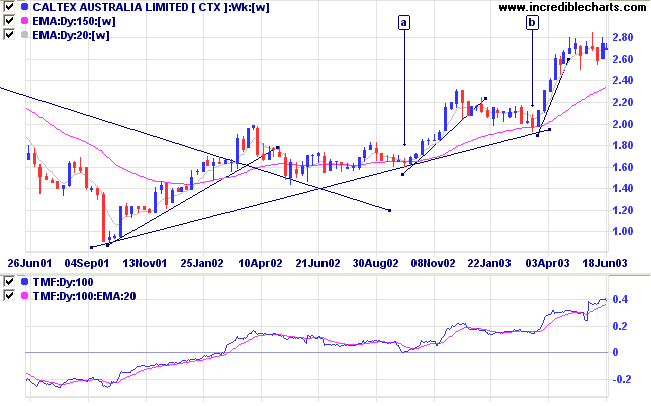
Equivolume indicates heavy resistance at 2.80 to 2.85 with an
over-square bar at [4].
Resistance continues with the broad bar at [6].
Resistance continues with the broad bar at [6].
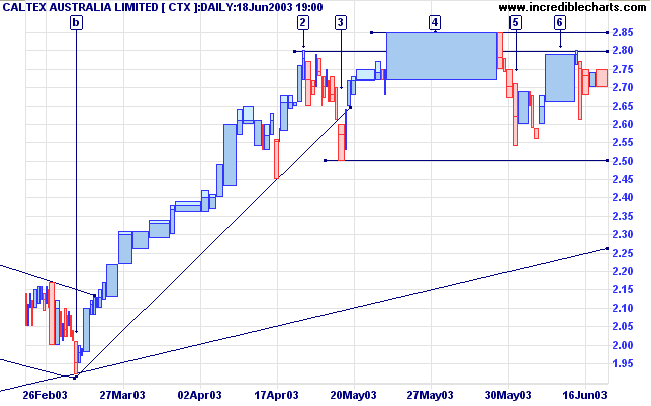
Resistance may not continue for the same length of time as the
earlier consolidation periods; we are now in a bull
market.
A rise above 2.85 will be a strong bull signal.
A fall below 2.50 will be bearish, signaling a re-test of support at the primary trendline.
A rise above 2.85 will be a strong bull signal.
A fall below 2.50 will be bearish, signaling a re-test of support at the primary trendline.
Understanding
the Trading Diary has been expanded to offer further
assistance to readers.
Colin Twiggs
A good plan today is better than a perfect plan
tomorrow.
~ General George S. Patton.
~ General George S. Patton.
Back Issues
Click here to access the Daily Trading Diary Archives.
Click here to access the Daily Trading Diary Archives.
Back Issues
Access the Trading Diary Archives.

Author: Colin Twiggs is a former investment banker with almost 40 years of experience in financial markets. He co-founded Incredible Charts and writes the popular Trading Diary and Patient Investor newsletters.
Using a top-down approach, Colin identifies key macro trends in the global economy before evaluating selected opportunities using a combination of fundamental and technical analysis.
Focusing on interest rates and financial market liquidity as primary drivers of the economic cycle, he warned of the 2008/2009 and 2020 bear markets well ahead of actual events.
He founded PVT Capital (AFSL No. 546090) in May 2023, which offers investment strategy and advice to wholesale clients.