Dow Jones Industrial Average Theoretical
[DJIA]
High and low values for the theoretical index assume that all stocks hit their highs at the same time (high value)
and their lows at the same time (low value). Volume shown is the entire volume traded on the NYSE.
High and low values for the theoretical index assume that all stocks hit their highs at the same time (high value)
and their lows at the same time (low value). Volume shown is the entire volume traded on the NYSE.
Dow Jones Industrial Average Actual
[DJIAA]
The high/low/close is calculated each hour and takes into account each stock's different price movements, up or down.
Volume shown is the NYSE volume for the thirty selected stocks.
See the Index Menu for details of other indexes.
The high/low/close is calculated each hour and takes into account each stock's different price movements, up or down.
Volume shown is the NYSE volume for the thirty selected stocks.
See the Index Menu for details of other indexes.
Trading Diary
June 16, 2003
These extracts from my daily trading diary are
intended to illustrate the techniques used in short-term trading
and should not be interpreted as investment advice. Full terms
and conditions can be found at Terms
of Use .
USA
The Dow rallied 2.2% to close at 9318 on average volume. The one-day correction on low volume, Friday, signals a strong up-trend.
The intermediate trend is up.
The primary up-trend is up.
The Dow rallied 2.2% to close at 9318 on average volume. The one-day correction on low volume, Friday, signals a strong up-trend.
The intermediate trend is up.
The primary up-trend is up.
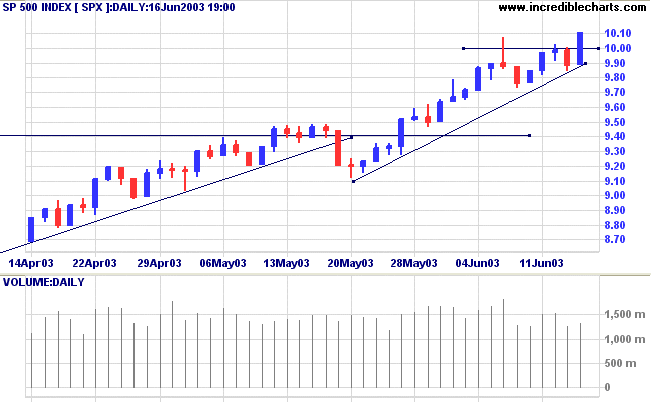
The S&P 500 broke strongly above the 1000 resistance level,
to close 12 points up at 1010.
The intermediate trend is up.
The primary trend is up.
The intermediate trend is up.
The primary trend is up.
The Nasdaq Composite closed 2.5% higher at 1666.
The intermediate trend is up.
The index is in a primary up-trend.
The intermediate trend is up.
The index is in a primary up-trend.
The Chartcraft NYSE Bullish % Indicator increased
slightly to 73.81% on June 13.
Market Strategy
Short-term: Long if the S&P 500 closes above 1000.
Intermediate: Long if the S&P closes above 1000.
Long-term: Long - the S&P 500 primary trend has turned upwards after two bull signals: the March 17 follow through day and the April 3 NYSE Bullish % signal.
Intermediate: Long if the S&P closes above 1000.
Long-term: Long - the S&P 500 primary trend has turned upwards after two bull signals: the March 17 follow through day and the April 3 NYSE Bullish % signal.
Manufacturing rise
The Federal Reserve of New York cheered the market when its' manufacturing index more than doubled, rising to 26.8 from 10.6 in May. (more)
The Federal Reserve of New York cheered the market when its' manufacturing index more than doubled, rising to 26.8 from 10.6 in May. (more)
Gold
New York (20.25): Spot gold climbed to $US 359.10.
On the five-year chart gold is above the long-term upward trendline.
New York (20.25): Spot gold climbed to $US 359.10.
On the five-year chart gold is above the long-term upward trendline.
ASX Australia
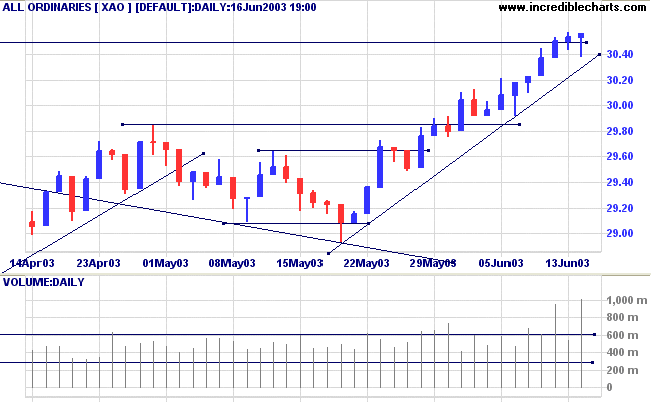
The All Ordinaries overcame its first test of the 3050 support
level, falling to 3038 in the morning before rallying to close at
3056 on exceptionally high volume.
The intermediate trend is up.
The primary trend is up.
The monthly Coppock indicator has turned up below zero, signaling the start of a bull market.
Twiggs Money Flow (100) signals accumulation.
MACD (26,12,9) is above its signal line; Slow Stochastic (20,3,3) is above; and Twiggs Money Flow (21) is rising strongly after completing a second bullish trough above zero.
Market Strategy
Short-term: Long if the All Ords is above 3050.
Intermediate: The primary trend has reversed up; Long if the All Ords is above 3050.
Long-term: The primary trend reversal has confirmed the March 18 follow through signal. Long if the All Ords is above 3050.
Intermediate: The primary trend has reversed up; Long if the All Ords is above 3050.
Long-term: The primary trend reversal has confirmed the March 18 follow through signal. Long if the All Ords is above 3050.
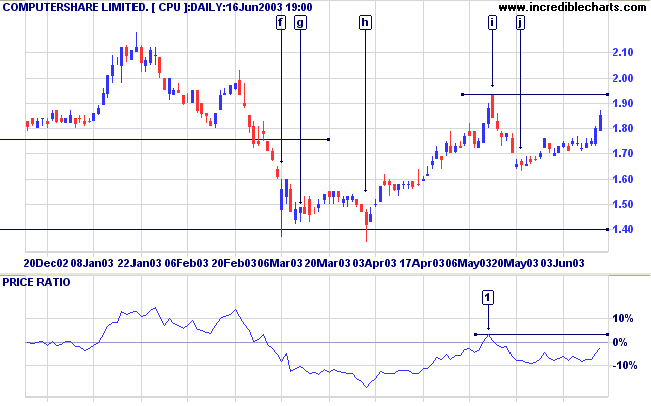
Computershare [CPU]
CPU has formed a broad stage 1 base after a lengthy decline.
Twiggs Money Flow (100) has risen strongly over the last 12 months to signal accumulation.
CPU has formed a broad stage 1 base after a lengthy decline.
Twiggs Money Flow (100) has risen strongly over the last 12 months to signal accumulation.
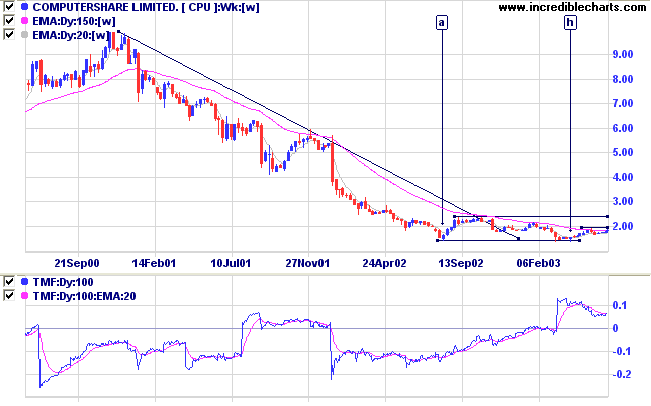
Initially, price formed a V-bottom at [a].
The pattern failed, as most V-bottoms do, after a sharp rally to [b].
CPU then drifted lower to re-test support at [f], forming a broad base in the process.
False (or marginal) breaks below the support level at [f] and [h] are a bullish sign.
Twiggs Money Flow (21) signals accumulation; and MACD (26,12,9) has completed a bullish trough above zero [+].
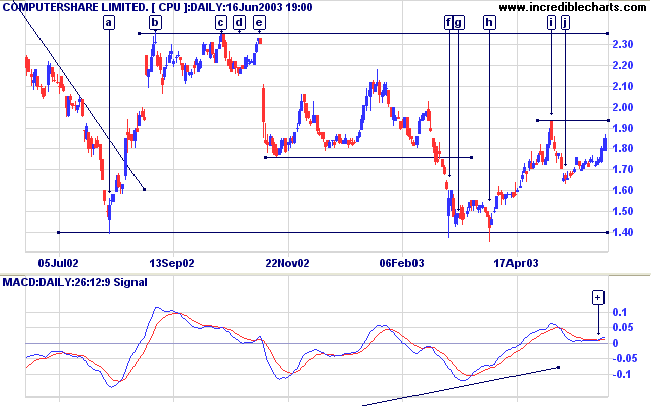
Relative Strength (price ratio: xao) is rising. Watch for a rise
above the 3-month high of [1].
Equivolume highlights strong buying support with an over-square
bar at [g].
You can also see the false breaks at [f] and [h], with closes back above the support level.
The subsequent rally ran out of momentum at [i] but regrouped at [j], after weak closes on fair volume.
The last two bars at [k] show strong gains on increased volume.
You can also see the false breaks at [f] and [h], with closes back above the support level.
The subsequent rally ran out of momentum at [i] but regrouped at [j], after weak closes on fair volume.
The last two bars at [k] show strong gains on increased volume.
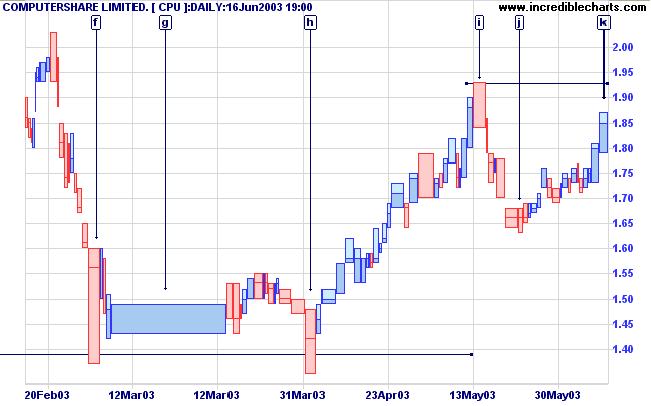
A rise above the high of [i] will be a bull signal.
Bear in mind that there is resistance overhead between 2.00 and 2.36.
A break above 2.36 will be a strong bull signal.
A fall below the low of [j] would be bearish.
Bear in mind that there is resistance overhead between 2.00 and 2.36.
A break above 2.36 will be a strong bull signal.
A fall below the low of [j] would be bearish.
Understanding
the Trading Diary has been expanded to offer further
assistance to readers.
Colin Twiggs
The true perfection of man lies, not in what man
has, but in what man is.
Nothing should be able to harm a man but himself.
Nothing should be able to rob a man at all.
What a man really has is what is in him.
What is outside of him should be a matter of no importance.
~ Oscar Wilde (1854-1900)
Nothing should be able to harm a man but himself.
Nothing should be able to rob a man at all.
What a man really has is what is in him.
What is outside of him should be a matter of no importance.
~ Oscar Wilde (1854-1900)
Back Issues
Click here to access the Daily Trading Diary Archives.
Click here to access the Daily Trading Diary Archives.
Back Issues
Access the Trading Diary Archives.

Author: Colin Twiggs is a former investment banker with almost 40 years of experience in financial markets. He co-founded Incredible Charts and writes the popular Trading Diary and Patient Investor newsletters.
Using a top-down approach, Colin identifies key macro trends in the global economy before evaluating selected opportunities using a combination of fundamental and technical analysis.
Focusing on interest rates and financial market liquidity as primary drivers of the economic cycle, he warned of the 2008/2009 and 2020 bear markets well ahead of actual events.
He founded PVT Capital (AFSL No. 546090) in May 2023, which offers investment strategy and advice to wholesale clients.