Trading Diary Archives
We are busy transferring the archives to a new area on the website
that is accessible only to Premium members.
We will notify you when the archives are available.
Trading Diary
June 12, 2003
These extracts from my daily trading diary are
intended to illustrate the techniques used in short-term trading
and should not be interpreted as investment advice. Full terms
and conditions can be found at Terms
of Use .
USA
After a strong rally Wednesday, the Dow failed to make further gains; closing slightly higher at 9196 on low volume.
The intermediate trend is up.
The primary up-trend is up.
After a strong rally Wednesday, the Dow failed to make further gains; closing slightly higher at 9196 on low volume.
The intermediate trend is up.
The primary up-trend is up.
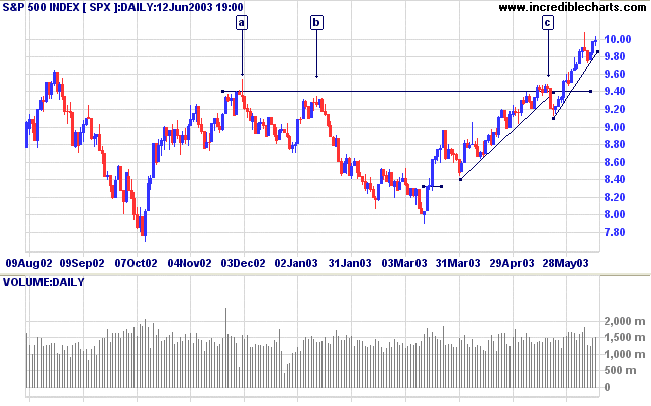
The S&P 500 again tested the 1000 level, but closed back
below at 998.
The intermediate trend is up.
The primary trend is up.
The intermediate trend is up.
The primary trend is up.
The Nasdaq Composite gained 0.5% to close at 1653.
The intermediate trend is up.
The index is in a primary up-trend.
The intermediate trend is up.
The index is in a primary up-trend.
The Chartcraft NYSE Bullish % Indicator rallied
to 72.90% on June 11; a 3-box
reversal would be a strong bear signal.
Market Strategy
Short-term: Long positions if the S&P 500 closes above
1000.
Intermediate: Long if the S&P closes above 1000.
Long-term: Long - the S&P 500 primary trend has turned upwards after two bull signals: the March 17 follow through day and the April 3 NYSE Bullish % signal.
Intermediate: Long if the S&P closes above 1000.
Long-term: Long - the S&P 500 primary trend has turned upwards after two bull signals: the March 17 follow through day and the April 3 NYSE Bullish % signal.
Oracle
The database software developer reported a 31% increase in fourth quarter earnings. (more)
The database software developer reported a 31% increase in fourth quarter earnings. (more)
Gold
New York (17.27): Spot gold eased to $US 353.00.
On the five-year chart gold is above the long-term upward trendline.
New York (17.27): Spot gold eased to $US 353.00.
On the five-year chart gold is above the long-term upward trendline.
ASX Australia
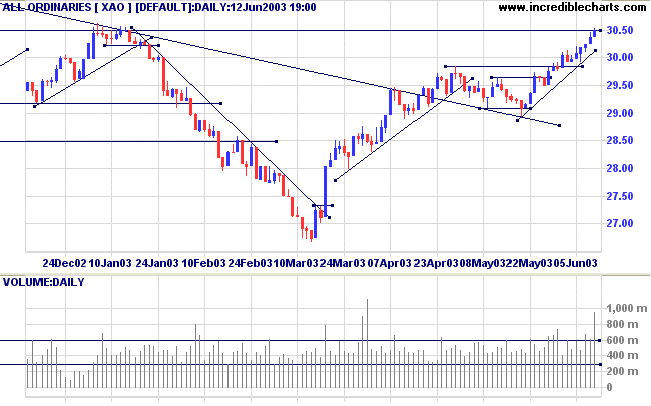
The All Ordinaries closed at 3050 after briefly penetrating the
resistance level during the day. Exceptionally high volume
highlights the significance of this level.
The intermediate trend is up.
A close above 3050 will signal the start of a primary up-trend.
The monthly Coppock indicator has turned up below zero, signaling the start of a bull market.
Twiggs Money Flow (100) signals accumulation.
MACD (26,12,9) is above its signal line; Slow Stochastic (20,3,3) is above; and Twiggs Money Flow (21) has completed a second bullish trough above zero.
Market Strategy
Short-term: Long if the All Ords rises above 3050; take short
positions if the XAO falls below 2908.
Intermediate: Long if the primary trend reverses up ( closes above 3050 ); short if the XAO is below 2908.
Long-term: There is already a bull signal: the March 18 follow through. Wait for confirmation from a primary trend reversal.
Intermediate: Long if the primary trend reverses up ( closes above 3050 ); short if the XAO is below 2908.
Long-term: There is already a bull signal: the March 18 follow through. Wait for confirmation from a primary trend reversal.
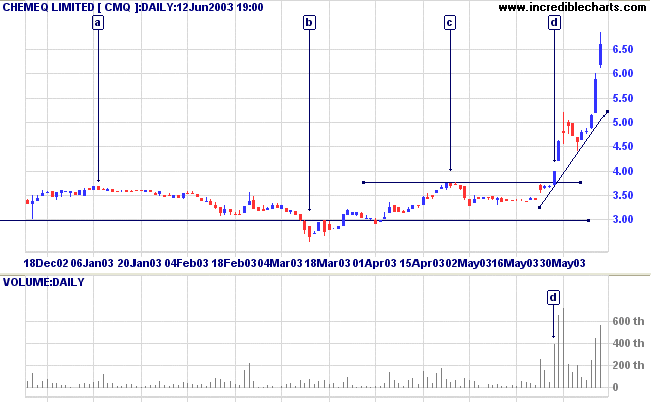
Chemeq [CMQ]
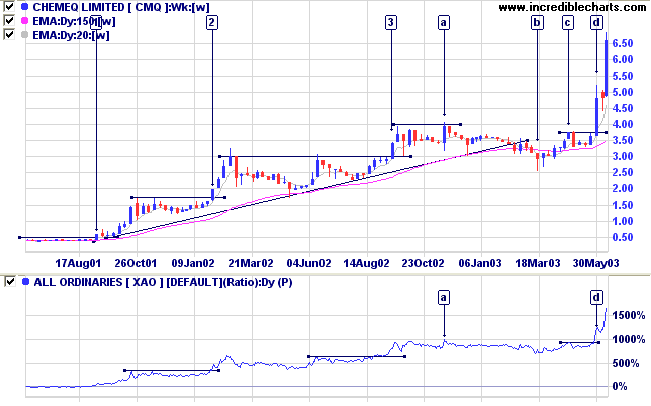
Chemeq has broken out of a broad consolidation pattern on exceptional volume.
The pattern resembles a cup and handle: the cup from [a] to [c], and the handle from [c] to [d].
I find the % Of 3-Month High stock screen (set at 98%) very useful for identifying potential breakouts.
In the weekly chart below, these can be identified as [1], [2], [3], [c] and [d].
When confirmed by a 3-month high on the Relative Strength indicator (price ratio: xao), and a spike in volume, they are exceptionally powerful.
Twiggs Money Flow (100) can provide further confirmation. In the case of CMQ, the indicator has signaled accumulation ever since [1].
The break above the high of [c], to complete the handle at [d],
was accompanied by a strong surge in volume.
Twiggs Money Flow (21) and MACD (26,12,9) have both completed bullish troughs above zero [+].
Twiggs Money Flow (21) and MACD (26,12,9) have both completed bullish troughs above zero [+].
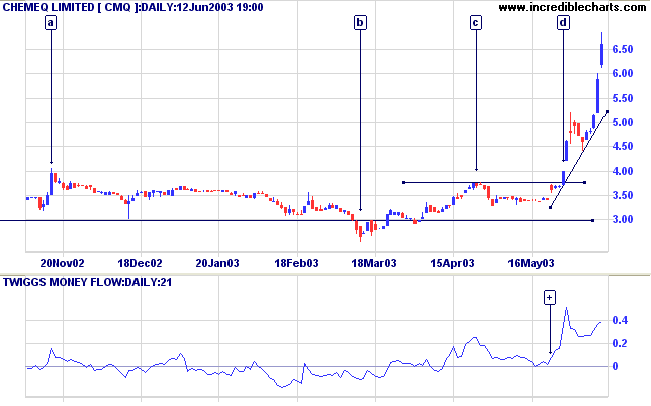
The breakout at [d] has started a fast up-trend with exceptional
volume support.
There is a strong possibility of the trend turning into a spike. Because of the high volatility, corrections can be as much as 30% of the current price.
There is a strong possibility of the trend turning into a spike. Because of the high volatility, corrections can be as much as 30% of the current price.
In these circumstances it is prudent, for short or intermediate
term strategies, to adjust your stop losses to lock in profits. A
percentage trailing stop of 6% or 8% can be
useful.
Beware: some brokers calculate % trailing stops based on closing price only and do not take the day's high and low into account. In volatile markets this can lead to significant losses and you may have to calculate your stops manually.
Re-enter if volume and range dry-up on the correction; using a buy-stop above the day's high.
Understanding
the Trading Diary has been expanded to offer further
assistance to readers.
Colin Twiggs
What we think, we become
~ Buddha, 568-488 B.C.
~ Buddha, 568-488 B.C.
Back Issues
Click here to access the Daily Trading Diary Archives.
Click here to access the Daily Trading Diary Archives.
Back Issues
Access the Trading Diary Archives.

Author: Colin Twiggs is a former investment banker with almost 40 years of experience in financial markets. He co-founded Incredible Charts and writes the popular Trading Diary and Patient Investor newsletters.
Using a top-down approach, Colin identifies key macro trends in the global economy before evaluating selected opportunities using a combination of fundamental and technical analysis.
Focusing on interest rates and financial market liquidity as primary drivers of the economic cycle, he warned of the 2008/2009 and 2020 bear markets well ahead of actual events.
He founded PVT Capital (AFSL No. 546090) in May 2023, which offers investment strategy and advice to wholesale clients.