Bugbear virus warning
Be very suspicious of emails with file attachments,
It is easy to impersonate a sender.
Check that your virus software has the latest updates
and scan all incoming mail. Bugbear files often have a .scr extension.
Trading Diary
June 11, 2003
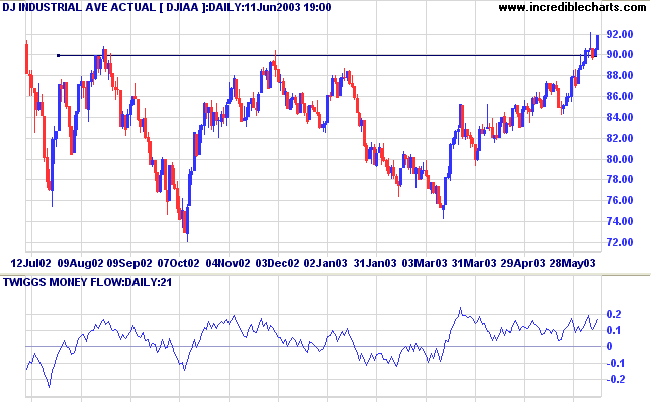
The Dow rallied 1.4% to 9183 but on low volume. Another close above the 9000 support level further reduces the likelihood of a false (marginal) break.
The intermediate trend is up.
The primary up-trend is up.
The intermediate trend is up.
The primary trend is up.
The intermediate trend is up.
The index is in a primary up-trend.
Intermediate: Long if the S&P is above 1000.
Long-term: Long - the S&P 500 primary trend has turned upwards after two bull signals: the March 17 follow through day and the April 3 NYSE Bullish % signal.
The "Beige Book" did not have much positive to say about the state of the economy, increasing hopes for a further rate cut from the June 24/25th Fed meeting. (more)
New York (17.03): Spot gold rose to $US 354.40.
On the five-year chart gold is above the long-term upward trendline.
The intermediate trend is up.
The primary trend is down. A close above 3050 will signal an up-trend.
The monthly Coppock indicator has turned up below zero, signaling the start of a bull market.
Twiggs Money Flow (100) signals accumulation.
MACD (26,12,9) is above its signal line; Slow Stochastic (20,3,3) is above; and Twiggs Money Flow (21) has completed a second bullish trough above zero.
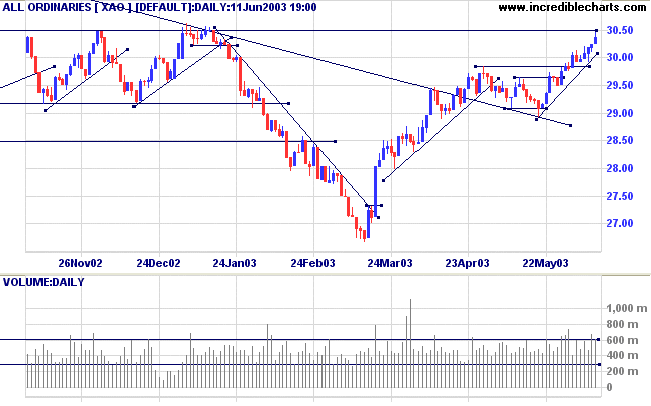
Intermediate: Long if the primary trend reverses up ( closes above 3050 ); short if the XAO is below 2908.
Long-term: There is already a bull signal: the March 18 follow through. Wait for confirmation from a primary trend reversal.
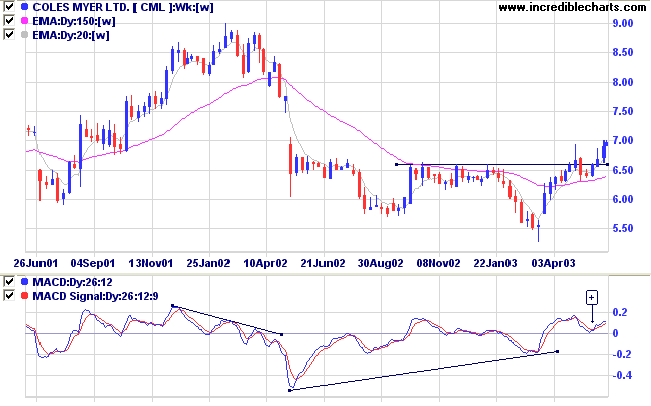
CML has been threatening to break out from a broad base for the past two months.
Twiggs Money Flow (100) signals accumulation and MACD (26,12,9) has completed a bullish trough above zero [+].
The following day, price broke below the support level on strong volume.
Relative Strength (price ratio: xao) has since shown a strong rise above zero and Twiggs Money Flow (21) signals accumulation.
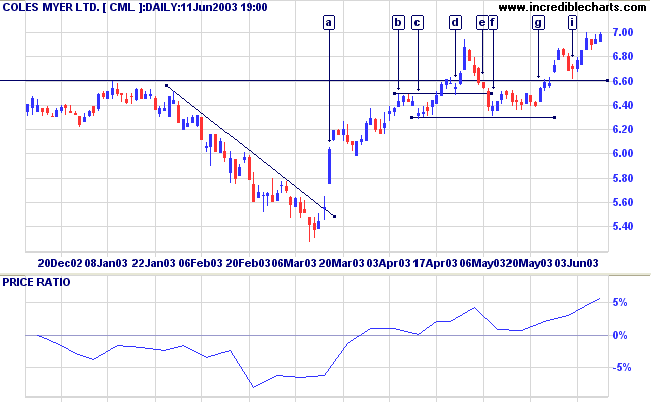
The following rally was very weak. Then CML consolidated in a narrow range below the resistance level; a bullish sign.
Finally, at [g] we receive confirmation with a break above the previous high on stronger volume.
The subsequent rally encountered selling pressure with square bars at [h].
The pull-back to support continues to show square bars, indicating strong buying absorbing the selling pressure.
The dry-up of volume at [i] is a bull signal. A buy-stop can be placed above the high; with a stop-loss a few ticks below 6.60.
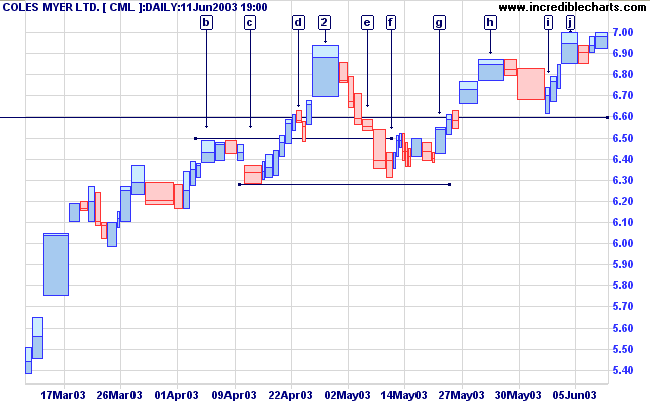
A close above 7.00 will be a bull signal.
Consolidation between 6.60 and 7.00 would be a long-term bull signal.
A close below 6.60 would be bearish.
till the mud settles and the water is clear?
Can you remain unmoving
till the right action arises by itself?
- Lao Tse.
Click here to access the Daily Trading Diary Archives.
Back Issues

Author: Colin Twiggs is a former investment banker with almost 40 years of experience in financial markets. He co-founded Incredible Charts and writes the popular Trading Diary and Patient Investor newsletters.
Using a top-down approach, Colin identifies key macro trends in the global economy before evaluating selected opportunities using a combination of fundamental and technical analysis.
Focusing on interest rates and financial market liquidity as primary drivers of the economic cycle, he warned of the 2008/2009 and 2020 bear markets well ahead of actual events.
He founded PVT Capital (AFSL No. 546090) in May 2023, which offers investment strategy and advice to wholesale clients.
