Bugbear virus warning
Be very suspicious of emails with file attachments,
whether they purport to be sent by Microsoft or
another normally reliable party.
It is easy to impersonate a sender.
Check that your virus software has the latest updates
and scan all incoming mail. Bugbear files often have a .scr extension.
It is easy to impersonate a sender.
Check that your virus software has the latest updates
and scan all incoming mail. Bugbear files often have a .scr extension.
Trading Diary
June 10, 2003
These extracts from my daily trading diary are
intended to illustrate the techniques used in short-term trading
and should not be interpreted as investment advice. Full terms
and conditions can be found at Terms
of Use .
USA
The Dow formed an inside day on low volume. The pattern signals uncertainty, but the close back above the 9000 support level (up 0.8% at 9054) reduces the likelihood of a false (marginal) break.
The intermediate trend is up.
The primary up-trend is up.
The Dow formed an inside day on low volume. The pattern signals uncertainty, but the close back above the 9000 support level (up 0.8% at 9054) reduces the likelihood of a false (marginal) break.
The intermediate trend is up.
The primary up-trend is up.
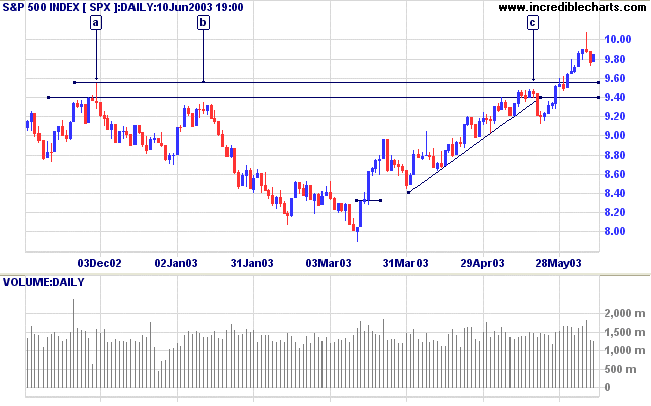
The S&P 500 formed an inside day, closing up 9 points at
984.
The intermediate trend is up.
The primary trend is up.
The intermediate trend is up.
The primary trend is up.
The Nasdaq Composite rallied 1.5% to close at 1627.
The intermediate trend is up.
The index is in a primary up-trend.
The intermediate trend is up.
The index is in a primary up-trend.
The Chartcraft NYSE Bullish % Indicator eased to
72.13% on June 9; the first reversal in several weeks.
Market Strategy
Short-term: Long if the S&P 500 is above 984.
Intermediate: Long if the S&P is above 1000.
Long-term: Long - the S&P 500 primary trend has turned upwards after two bull signals: the March 17 follow through day and the April 3 NYSE Bullish % signal.
Intermediate: Long if the S&P is above 1000.
Long-term: Long - the S&P 500 primary trend has turned upwards after two bull signals: the March 17 follow through day and the April 3 NYSE Bullish % signal.
Nokia
The world's largest cell phone maker warns that earnings will be at the low end of previous forecasts, due to weak economic conditions in the US and Europe, and the impact of SARS in China. (more)
The world's largest cell phone maker warns that earnings will be at the low end of previous forecasts, due to weak economic conditions in the US and Europe, and the impact of SARS in China. (more)
Gold
New York (16.48): Spot gold dropped to $US 352.20.
On the five-year chart gold is above the long-term upward trendline.
New York (16.48): Spot gold dropped to $US 352.20.
On the five-year chart gold is above the long-term upward trendline.
ASX Australia
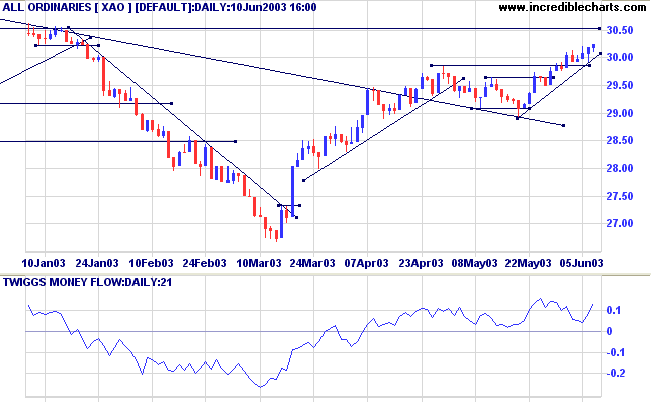
The ASX shrugged off Monday's poor performance in the US, with
the All Ordinaries closing up 5 points at 3023 on strong
volume.
The intermediate trend is up.
The primary trend is down. A close above 3050 will signal an up-trend.
The monthly Coppock indicator has turned up below zero, signaling the start of a bull market.
Twiggs Money Flow (100) has crossed to above zero, signaling accumulation.
MACD (26,12,9) is above its signal line; Slow Stochastic (20,3,3) is above; and Twiggs Money Flow (21) signals accumulation.
Market Strategy
Short-term: Long if the All Ords is above 3021; short if the XAO
falls below 2908.
Intermediate: Long if the primary trend reverses up ( closes above 3050 ); short if the XAO is below 2908.
Long-term: There is already a bull signal: the March 18 follow through. Wait for confirmation from a primary trend reversal.
Intermediate: Long if the primary trend reverses up ( closes above 3050 ); short if the XAO is below 2908.
Long-term: There is already a bull signal: the March 18 follow through. Wait for confirmation from a primary trend reversal.
National Australia Bank [NAB]
NAB recently completed an inverted head and shoulders, at [8], [10] and [13].
Weekly volume on the breakout [14] was average, but surged in the following week on the pull-back to the 33.00 support line.
NAB recently completed an inverted head and shoulders, at [8], [10] and [13].
Weekly volume on the breakout [14] was average, but surged in the following week on the pull-back to the 33.00 support line.
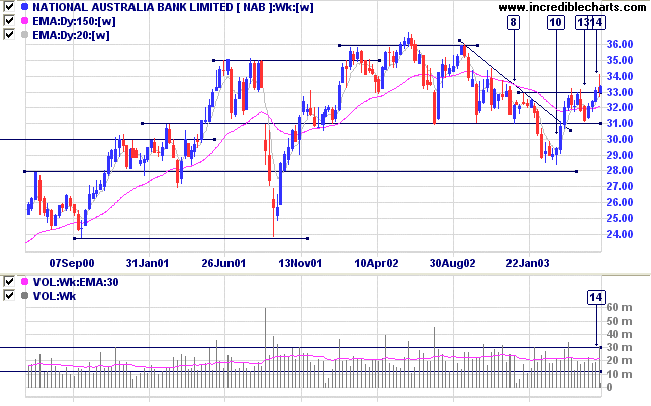
The NAB chart has a symmetry that you don't often see nowadays:
support and resistance forms at round numbers, with
well-established levels at 24, 28, 30 (earlier), 31, 35 and
36.
Twiggs Money Flow (100) has crossed to above zero, signaling accumulation.
Relative Strength (price ratio: xao) and Twiggs Money Flow (21) have held above zero; MACD is bullish.
Twiggs Money Flow (100) has crossed to above zero, signaling accumulation.
Relative Strength (price ratio: xao) and Twiggs Money Flow (21) have held above zero; MACD is bullish.
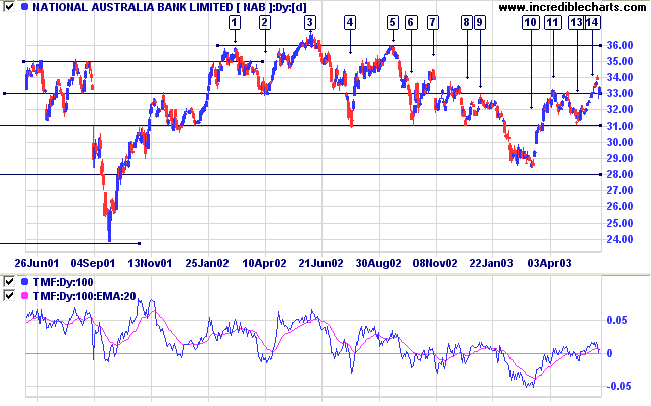
The equivolume chart shows a brief double top at [11] and [12]
with strong selling pressure on the second peak.
Price then retreated back to support at 31.00, exhausting momentum with a downward gap on fair volume at [13], the weak close hinting at a reversal. The following day gapped up, completing an island reversal.
NAB then broke above the 33.00 resistance level at [14] on strong volume but the weak close indicated selling pressure.
The rally continued on thin volume, before the peak at [15] formed another island reversal following a weak close.
The gap down to [16] was on strong volume; the close above the support line signaling strong buying support at 33.00.
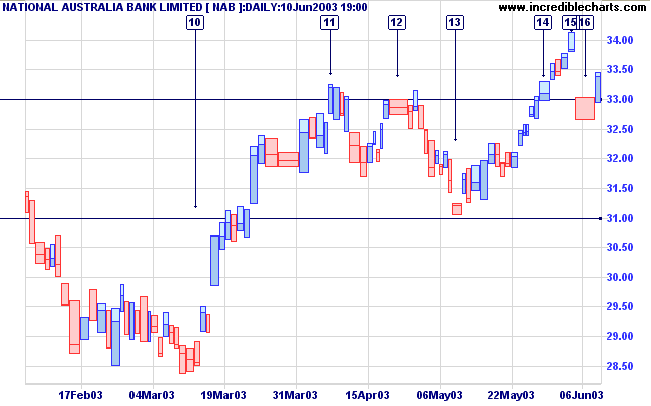
The latest bar shows a rally on reasonable volume.
A break above the high of [15] would be bullish.
Failure to break above [15] may result in consolidation above the support level, a bullish sign in the longer term.
A close below 33.00 would be bearish.
A break above the high of [15] would be bullish.
Failure to break above [15] may result in consolidation above the support level, a bullish sign in the longer term.
A close below 33.00 would be bearish.
Understanding
the Trading Diary has been expanded to offer further
assistance to readers.
Colin Twiggs
Avoiding danger is no safer in the long run
than outright exposure.
The fearful are caught as often as the bold.
- Helen Keller.
The fearful are caught as often as the bold.
- Helen Keller.
Back Issues
Click here to access the Daily Trading Diary Archives.
Click here to access the Daily Trading Diary Archives.
Back Issues
Access the Trading Diary Archives.

Author: Colin Twiggs is a former investment banker with almost 40 years of experience in financial markets. He co-founded Incredible Charts and writes the popular Trading Diary and Patient Investor newsletters.
Using a top-down approach, Colin identifies key macro trends in the global economy before evaluating selected opportunities using a combination of fundamental and technical analysis.
Focusing on interest rates and financial market liquidity as primary drivers of the economic cycle, he warned of the 2008/2009 and 2020 bear markets well ahead of actual events.
He founded PVT Capital (AFSL No. 546090) in May 2023, which offers investment strategy and advice to wholesale clients.