Trading Diary
June 6, 2003
These extracts from my daily trading diary are
intended to illustrate the techniques used in short-term trading
and should not be interpreted as investment advice. Full terms
and conditions can be found at Terms
of Use .
USA
The Dow formed a gravestone candle, closing 0.2% higher at 9062 on higher volume. The pattern signals short-term weakness and we are likely to see a re-test of the new 9000 support level.
The intermediate trend is up.
The primary up-trend is up.
The Dow formed a gravestone candle, closing 0.2% higher at 9062 on higher volume. The pattern signals short-term weakness and we are likely to see a re-test of the new 9000 support level.
The intermediate trend is up.
The primary up-trend is up.
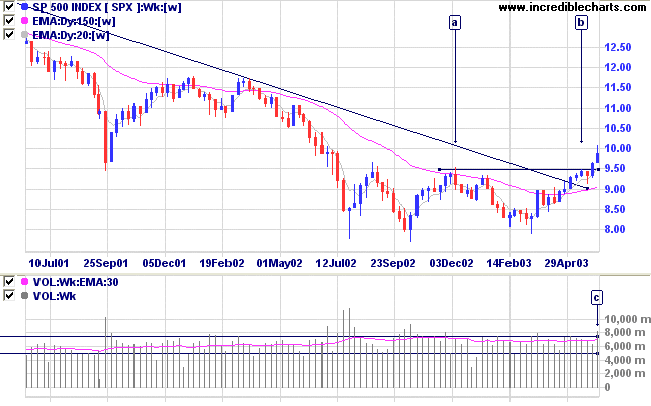
The S&P 500 briefly flirted with the symbolic 1000 level
before retreating to close 3 points down at 987. The index formed
a similar reversal pattern to the Dow and is likely to re-test
support at 950.
The intermediate trend is up.
The primary trend is up, with the index having broken above the high of [a] on strong volume [c].
The intermediate trend is up.
The primary trend is up, with the index having broken above the high of [a] on strong volume [c].
The Nasdaq Composite shows a
closing price reversal, losing more than 1% to close at
1627.
The intermediate trend is up.
The index is in a primary up-trend.
The intermediate trend is up.
The index is in a primary up-trend.
The Chartcraft NYSE Bullish % Indicator climbed
to 70.50% on June 5; following a Bull
Correction buy signal (April 3).
Market Strategy
Short-term: Long if the S&P 500 is above 1000.
Intermediate: Long if the S&P is above 1000.
Long-term: Long - the S&P 500 primary trend has turned upwards after two bull signals: the March 17 follow through day and the April 3 NYSE Bullish % signal.
Intermediate: Long if the S&P is above 1000.
Long-term: Long - the S&P 500 primary trend has turned upwards after two bull signals: the March 17 follow through day and the April 3 NYSE Bullish % signal.
Unemployment
Unemployment levels increased to 6.1% in May, but job cuts are below forecasts. (more)
Unemployment levels increased to 6.1% in May, but job cuts are below forecasts. (more)
Gold
New York (15.30): Spot gold closed the week down at $US 363.60.
On the five-year chart gold is above the long-term upward trendline.
New York (15.30): Spot gold closed the week down at $US 363.60.
On the five-year chart gold is above the long-term upward trendline.
ASX Australia
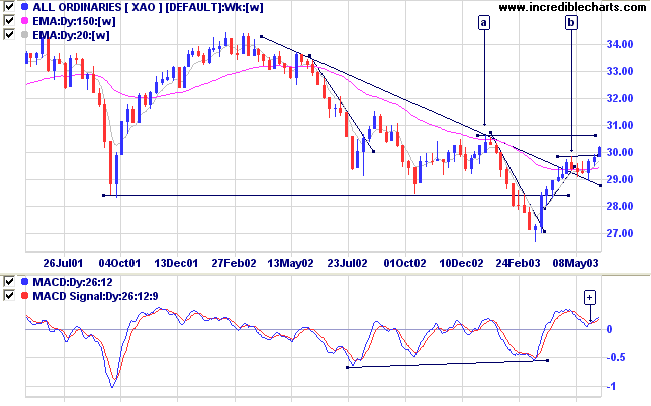
On the long-term charts, the monthly Coppock indicator has turned
up below zero, signaling the start of a bull market.
MACD has completed a bullish trough above zero.
Twiggs Money Flow (100) has crossed to above zero after a lengthy period of distribution.
MACD has completed a bullish trough above zero.
Twiggs Money Flow (100) has crossed to above zero after a lengthy period of distribution.
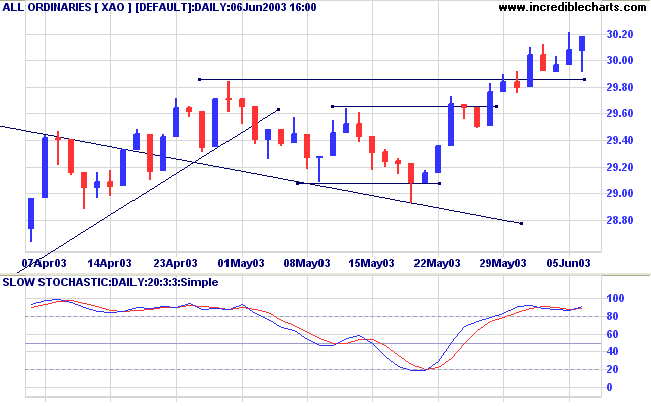
Daily Chart:
After falling through the morning the All Ordinaries rallied to close up 10 points at 3018, but on disappointing volume.
The intermediate trend is up.
The primary trend is down. A close above 3050 will signal an up-trend.
MACD (26,12,9) is above its signal line; Slow Stochastic (20,3,3) crossed to above its signal line; and Twiggs Money Flow (21) signals accumulation.
Market Strategy
Short-term: Long if the All Ords rises above 3018; short if the
XAO falls below 2908.
Intermediate: Long if the primary trend reverses up ( closes above 3050 ); short if the XAO is below 2908.
Long-term: There is already a bull signal: the March 18 follow through. Wait for confirmation from a primary trend reversal.
Intermediate: Long if the primary trend reverses up ( closes above 3050 ); short if the XAO is below 2908.
Long-term: There is already a bull signal: the March 18 follow through. Wait for confirmation from a primary trend reversal.
Sector Analysis
Changes are highlighted in bold.
Changes are highlighted in bold.
- Energy [XEJ] - stage 1 (RS is level)
- Materials [XMJ] - stage 3 (RS is falling)
- Industrials [XNJ] - stage 4 (RS is falling)
- Consumer Discretionary [XDJ] - stage 1 (RS is level)
- Consumer Staples [XSJ] - stage 1 (RS is level)
- Health Care [XHJ] - stage 4 (RS is falling)
- Property Trusts [XPJ] - stage 2 (RS is rising)
- Financial excl. Property Trusts [XXJ] - stage 1 (RS is rising)
- Information Technology [XIJ] - stage 4 (RS is falling)
- Telecom Services [XTJ] - stage 4 (RS is level)
- Utilities [XUJ] - stage 2 (RS is rising)
Sectors: Relative Strength
A stock screen of the ASX 200 using % Price Move (1 month: +5%) is up slightly to 61 stocks (compared to 131 on April 11, 2003; and 8 on March 14, 2003).
A stock screen of the ASX 200 using % Price Move (1 month: +5%) is up slightly to 61 stocks (compared to 131 on April 11, 2003; and 8 on March 14, 2003).
- Banks (6)
- Broadcasting & Cable TV (5)
- Diversified Financial (4)
Daily Trading Diary
Stocks analyzed during the week were:
Stocks analyzed during the week were:
- Kingsgate Consolidated - KCN
- Sonic Health Care - SHL
- Bank of Queensland - BOQ
- Commonwealth Bank - CBA
- Telecom New Zealand - TEL
Understanding
the Trading Diary has been expanded to offer further
assistance to readers.
Colin Twiggs
I have only a second rate brain,
but I think I have a capacity for action.
- Theodore Roosevelt, one of the most popular US Presidents.
but I think I have a capacity for action.
- Theodore Roosevelt, one of the most popular US Presidents.
Back Issues
Access the Trading Diary Archives.

Author: Colin Twiggs is a former investment banker with almost 40 years of experience in financial markets. He co-founded Incredible Charts and writes the popular Trading Diary and Patient Investor newsletters.
Using a top-down approach, Colin identifies key macro trends in the global economy before evaluating selected opportunities using a combination of fundamental and technical analysis.
Focusing on interest rates and financial market liquidity as primary drivers of the economic cycle, he warned of the 2008/2009 and 2020 bear markets well ahead of actual events.
He founded PVT Capital (AFSL No. 546090) in May 2023, which offers investment strategy and advice to wholesale clients.