
To find out more about US indexes
follow the links on the Indexes
page.
Trading Diary
June 4, 2003
These extracts from my daily trading diary are
intended to illustrate the techniques used in short-term trading
and should not be interpreted as investment advice. Full terms
and conditions can be found at Terms
of Use .
USA
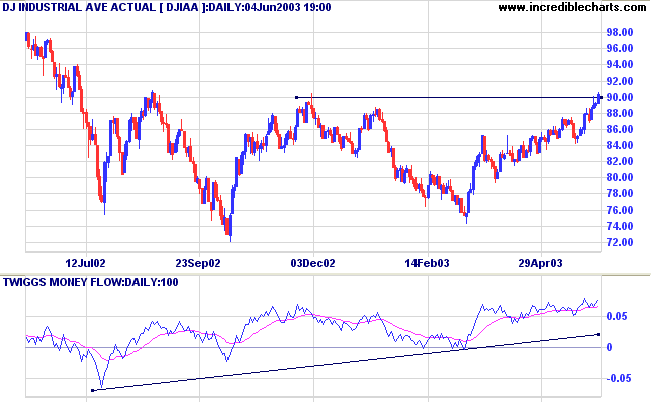
The Dow broke through the 9000 resistance level, rallying 1.3% to close at 9038 on higher volume.
The intermediate trend is up.
The close above 9000 signals the start of a primary up-trend.
The Dow broke through the 9000 resistance level, rallying 1.3% to close at 9038 on higher volume.
The intermediate trend is up.
The close above 9000 signals the start of a primary up-trend.
The S&P 500 rallied strongly, closing 15 points up at
986.
The intermediate trend is up.
The primary trend is up.
The intermediate trend is up.
The primary trend is up.
The Nasdaq Composite rallied 2.0% to close at 1634.
The intermediate trend is up.
The index is in a primary up-trend.
The intermediate trend is up.
The index is in a primary up-trend.
The Chartcraft NYSE Bullish % Indicator is almost
unchanged at 68.17% on June 3; following a Bull
Correction buy signal (April 3).
Market Strategy
Short-term: Long if the S&P 500 is above 979.
Intermediate: Long if the S&P is above 979.
Long-term: Long - the S&P 500 primary trend has turned upwards after two bull signals: the March 17 follow through day and the April 3 NYSE Bullish % signal.
Intermediate: Long if the S&P is above 979.
Long-term: Long - the S&P 500 primary trend has turned upwards after two bull signals: the March 17 follow through day and the April 3 NYSE Bullish % signal.
Service sector boost
The Institute for Supply Management's index of non-manufacturing activity jumped to 54.7 in May, compared to 50.2 in April and well above expectations. (more)
The Institute for Supply Management's index of non-manufacturing activity jumped to 54.7 in May, compared to 50.2 in April and well above expectations. (more)
Gold
New York (17.54): Spot gold has fallen to $US 361.50.
On the five-year chart gold is above the long-term upward trendline.
New York (17.54): Spot gold has fallen to $US 361.50.
On the five-year chart gold is above the long-term upward trendline.
ASX Australia
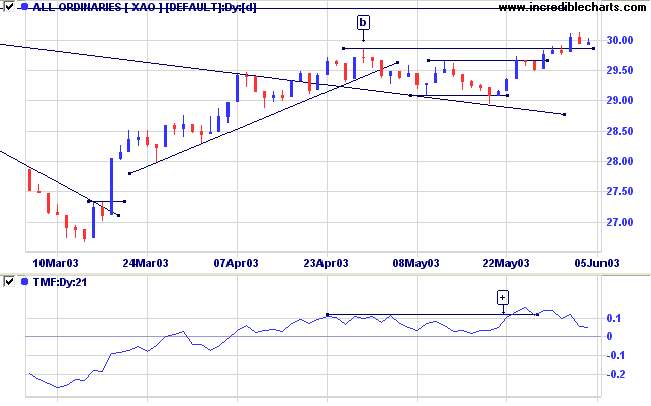
The monthly Coppock indicator has turned up below zero, signaling
the start of a bull market, while the XAO has broken above the
long-term downward trendline.
The All Ordinaries closed up 5 points at 2997 on lower volume.
The short-term weakness should be overcome by the positive
sentiment from US markets.
The intermediate trend is up.
The primary trend is down. A close above 3050 will signal an up-trend.
MACD (26,12,9) is above its signal line, having completed a bullish trough above zero at [+]; Slow Stochastic (20,3,3) is below its signal line; and Twiggs Money Flow (21) continues to hold above zero, signaling accumulation.
Market Strategy
Short-term: Long if the All Ords rises above 3003; short if the
XAO falls below 2908.
Intermediate: Long if the primary trend reverses up ( closes above 3050 ); short if the XAO is below 2908.
Long-term: There is already a bull signal: the March 18 follow through. Wait for confirmation from a primary trend reversal.
Intermediate: Long if the primary trend reverses up ( closes above 3050 ); short if the XAO is below 2908.
Long-term: There is already a bull signal: the March 18 follow through. Wait for confirmation from a primary trend reversal.
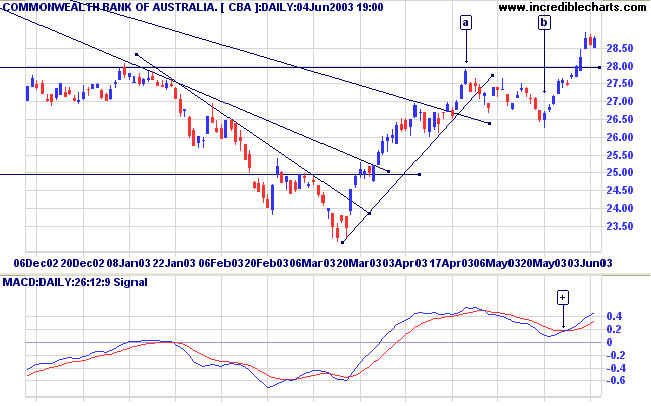
Commonwealth Bank [CBA]
Last covered on December 18, 2002.
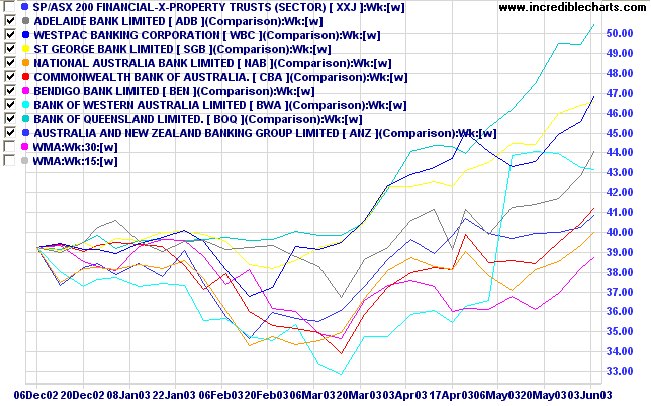
The banking sector shows a number of stocks moving into up-trends.
CBA has just exceeded its April high.
Last covered on December 18, 2002.
The banking sector shows a number of stocks moving into up-trends.
CBA has just exceeded its April high.
On the weekly chart price has just broken above the important
28.00 resistance level.
Twiggs Money Flow (100) has crossed to above zero, signaling accumulation.
Twiggs Money Flow (100) has crossed to above zero, signaling accumulation.
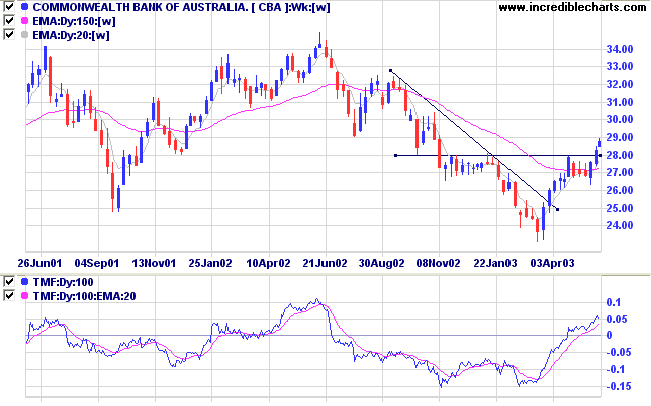
MACD (26,12,9) has completed a bullish trough above the zero
line.
Relative Strength (price ratio: xao) is rising.
Twiggs Money Flow (21) signals accumulation.
Price tested the resistance level at [a], but then consolidated below 28.00 at [b] instead of swinging back down to test support levels (below 24.00) - a strong bullish sign.
Relative Strength (price ratio: xao) is rising.
Twiggs Money Flow (21) signals accumulation.
Price tested the resistance level at [a], but then consolidated below 28.00 at [b] instead of swinging back down to test support levels (below 24.00) - a strong bullish sign.
Equivolume highlights the resistance at [a],
with heavy volume but no penetration above 28.00.
Volume to [b] is lighter, supporting the bullish signal.
On the next rally, price hesitates at [c] before breaking above resistance on strong volume at [d].
What we now see is a pull-back to test support at 28.00.
Volume to [b] is lighter, supporting the bullish signal.
On the next rally, price hesitates at [c] before breaking above resistance on strong volume at [d].
What we now see is a pull-back to test support at 28.00.
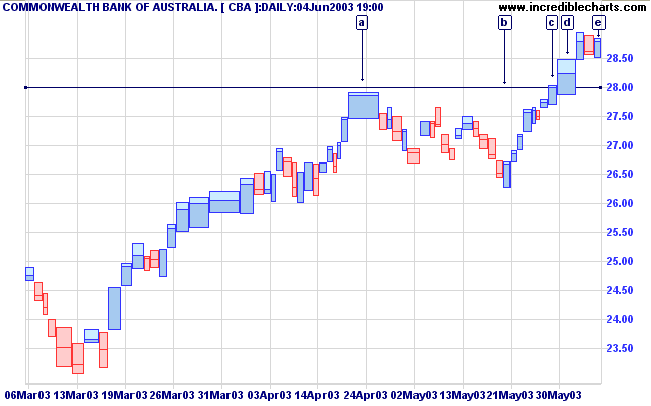
A break above the high of [e] will be a bull signal: the
pull-back is short and on lower volume.
There may still be a later pull-back to re-test the support level:
There may still be a later pull-back to re-test the support level:
- short-term traders may move their stops up below each subsequent trough, to lock in profits;
- longer-term traders may hold their stop below 28.00 for quite some time, to avoid being shaken out of the up-trend.
Understanding
the Trading Diary has been expanded to offer further
assistance to readers.
Colin Twiggs
Double your rate of failure.
Failure is a teacher
- a harsh one, perhaps, but the best.
So go ahead and make mistakes.
Make all you can.
Because that is where you will find success.
On the far side of failure.
- Thomas J Watson.
[CT: obviously not with all your capital at risk]
Failure is a teacher
- a harsh one, perhaps, but the best.
So go ahead and make mistakes.
Make all you can.
Because that is where you will find success.
On the far side of failure.
- Thomas J Watson.
[CT: obviously not with all your capital at risk]
Back Issues
Click here to access the Trading Diary Archives.
Click here to access the Trading Diary Archives.

Author: Colin Twiggs is a former investment banker with almost 40 years of experience in financial markets. He co-founded Incredible Charts and writes the popular Trading Diary and Patient Investor newsletters.
Using a top-down approach, Colin identifies key macro trends in the global economy before evaluating selected opportunities using a combination of fundamental and technical analysis.
Focusing on interest rates and financial market liquidity as primary drivers of the economic cycle, he warned of the 2008/2009 and 2020 bear markets well ahead of actual events.
He founded PVT Capital (AFSL No. 546090) in May 2023, which offers investment strategy and advice to wholesale clients.