The next issue of the daily Trading Diary
will be exclusive to Premium members.
Premium members will also have exclusive access
to the website archives.
The weekend issue of the Trading Diary will continue to be sent to all members.
Trading Diary
May 30, 2003
The Dow rallied 1.6% to close at 8850 on above-average volume.
The intermediate trend is up.
The primary trend is down; a close above 9076 will signal a reversal.
The intermediate trend is up.
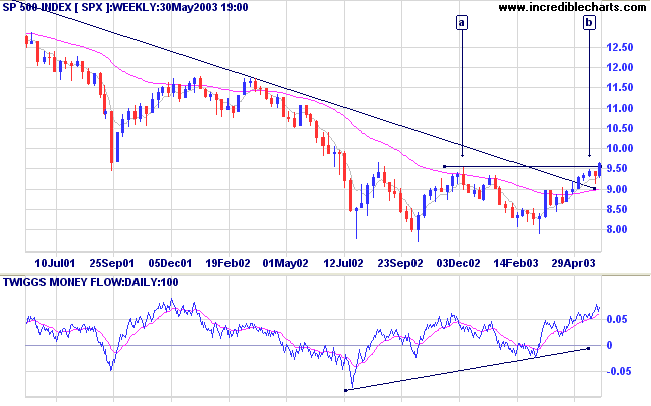
The primary trend closed above 954 [a], signaling the start of an up-trend.

The intermediate trend is up.
The index is in a primary up-trend.

Intermediate: Long - the primary trend has reversed up (S&P above 954).
Long-term: There are already two bull signals: the March 17 follow through day and the April 3 NYSE Bullish % signal. Long - the S&P 500 primary trend has turned upwards.
The National Association of Purchasing Management says that its Chicago-region manufacturing index for May has jumped to 52.2 from 47.6, well above expectations. (more)
New York (15.30): Spot gold closed down at $US 364.10.
On the five-year chart gold is above the long-term upward trendline.

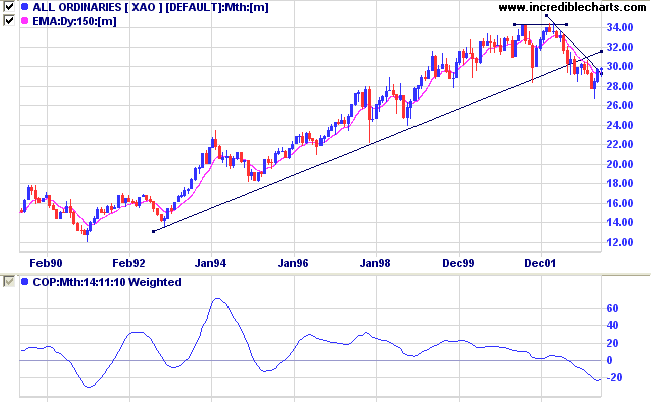
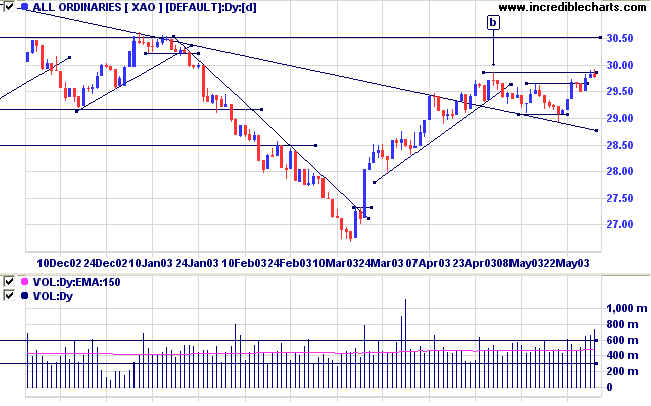
The intermediate trend is up.
The primary trend is down. A close above 3050 will signal an up-trend.
MACD (26,12,9) is above its signal line; Slow Stochastic (20,3,3) is above; and Twiggs Money Flow (21) shows accumulation.

Intermediate: Long if the primary trend reverses up ( closes above 3050 ); short if the XAO is below 2908.
Long-term: There is already a bull signal: the March 18 follow through. Wait for confirmation from a primary trend reversal.
Changes are highlighted in bold.
- Energy [XEJ] - stage 1 (RS is level)
- Materials [XMJ] - stage 3 (RS is falling)
- Industrials [XNJ] - stage 4 (RS is falling)
- Consumer Discretionary [XDJ] - stage 1 (RS is level)
- Consumer Staples [XSJ] - stage 1 (RS is level)
- Health Care [XHJ] - stage 4 (RS is falling)
- Property Trusts [XPJ] - stage 2 (RS is rising)
- Financial excl. Property Trusts [XXJ] - stage 1 (RS is rising)
- Information Technology [XIJ] - stage 4 (RS is falling)
- Telecom Services [XTJ] - stage 4 (RS is level)
- Utilities [XUJ] - stage 2 (RS is rising)
A stock screen of the ASX 200 using % Price Move (1 month: +5%) eased to 57 stocks (compared to 131 on April 11, 2003; and 8 on March 14, 2003).
- REITs (5)
- Diversified Financial (4)
- Gold (3)
- Banks (3)
- Broadcasting & Cable TV
Life is like the Olympic games;
a few men strain their muscles to carry off a prize,
others sell trinkets to the crowd for a profit;
some just come to see how everything is done.
- Pythagoras (569 - 475 B.C.)
Click here to access the Trading Diary Archives.
Back Issues

Author: Colin Twiggs is a former investment banker with almost 40 years of experience in financial markets. He co-founded Incredible Charts and writes the popular Trading Diary and Patient Investor newsletters.
Using a top-down approach, Colin identifies key macro trends in the global economy before evaluating selected opportunities using a combination of fundamental and technical analysis.
Focusing on interest rates and financial market liquidity as primary drivers of the economic cycle, he warned of the 2008/2009 and 2020 bear markets well ahead of actual events.
He founded PVT Capital (AFSL No. 546090) in May 2023, which offers investment strategy and advice to wholesale clients.
