US indexes are now available to Premium members.
ASX hourly updates from tomorrow. See What's New for details.
Check Help >> About to ensure that your software has been updated to Incredible Charts version 4.0.2.200.
Earlier versions will no longer work with the new data.
Trading Diary
May 27, 2003
The Dow made another follow through day, closing up more than 2.0% at 8781 on strong volume.
The intermediate trend is up. The rise above 8766 signals continuation.
The primary trend is down; a rise above 9076 will signal a reversal.
The intermediate trend is up. The rise above 948 signals continuation.
The primary trend is down; a rise above 954 will signal an up-trend.
The intermediate trend is up. The rise above 1552 signals continuation.
The index is in a primary up-trend.
Intermediate: Long if the primary trend reverses up (S&P rises above 954).
Long-term: There are already two bull signals: the March 17 follow through day and the April 3 NYSE Bullish % signal. Long if the S&P 500 primary trend turns upwards.
A better than expected consumer confidence report boosted tech stocks, including blue chips Microsoft, IBM and Dell. (more)
New York (18.15): Spot gold dropped sharply, currently trading at $US 365.20.
On the five-year chart gold has respected the long-term upward trendline.
The intermediate trend is down but on a weak signal. A rise above 2973 will signal reversal.
The primary trend is down. A rise above 3062 will signal an up-trend.
Slow Stochastic (20,3,3) has crossed to above its signal line; Twiggs Money Flow (21) shows bullish accumulation; MACD (26,12,9) is still below its signal line.
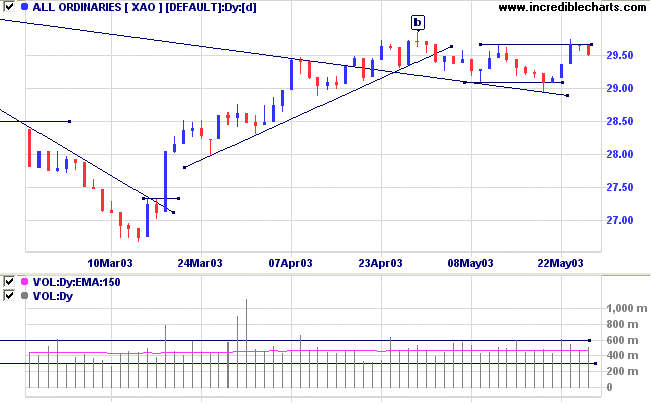
Intermediate: Long if the primary trend reverses up ( crosses above 3062 ); short if the XAO is below 2908.
Long-term: There is already a bull signal: the March 18 follow through. Wait for confirmation from a primary trend reversal.
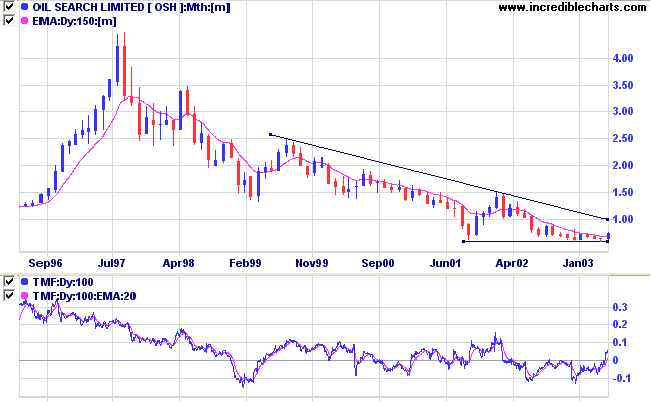
Last covered on April 22, 2003.
I find that the 3-Month % Of High stock screen turns up a number of breakouts from stage 1 bases. OSH has formed a broad base after a lengthy down-trend. Twiggs Money Flow (100) has climbed above zero, signaling accumulation.
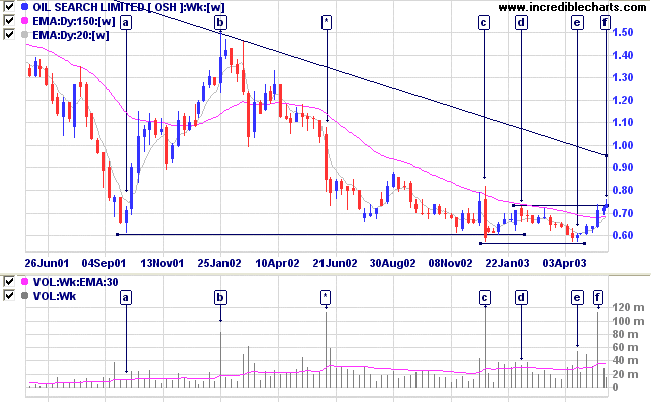
The pattern is completed by a breakout at [f].
Note the higher volume at [c] and [f], with a lower spike at [e].
Relative Strength (price ratio: xao) and MACD are rising; Twiggs Money Flow (21) respected the zero line, a strong bull signal.
The rally to [f] shows strong volume, but some weak closes indicate selling into the rally.
Volume at [1], after the breakout, appears thin.
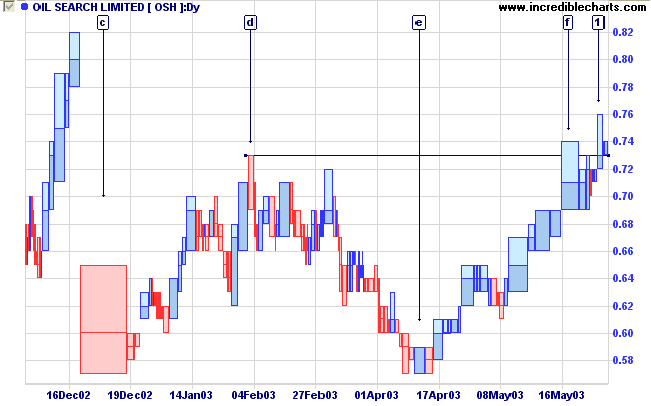
This presents an opportunity to place tight stops just below the low of the pull-back.
A break below 0.69, the low of [f], would be bearish, signaling a re-test of the base support levels.
The power of acute observation
is commonly called cynicism
by those who have not got it.
- George Bernard Shaw
Click here to access the Trading Diary Archives.
Back Issues

Author: Colin Twiggs is a former investment banker with almost 40 years of experience in financial markets. He co-founded Incredible Charts and writes the popular Trading Diary and Patient Investor newsletters.
Using a top-down approach, Colin identifies key macro trends in the global economy before evaluating selected opportunities using a combination of fundamental and technical analysis.
Focusing on interest rates and financial market liquidity as primary drivers of the economic cycle, he warned of the 2008/2009 and 2020 bear markets well ahead of actual events.
He founded PVT Capital (AFSL No. 546090) in May 2023, which offers investment strategy and advice to wholesale clients.