If you activated your free trial when the Premium version was first introduced,
you may notice that your free trial has expired but that you still have access to Premium data.
We will shortly introduce US indexes and hourly updates for ASX stocks,
and the free trial period has been extended to fit in with this.
Trading Diary
May 22, 2003
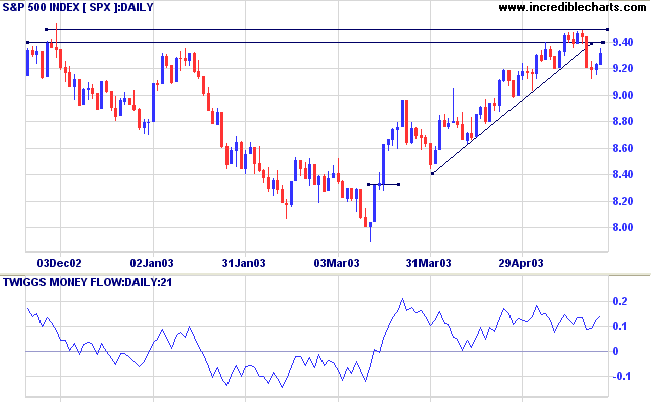
The intermediate upward trendline has been broken. A rise above 8766 will signal continuation; a fall below 8394 will signal a reversal.
The primary trend is down; a rise above 9076 will signal a reversal.
The intermediate upward trend is weak. A fall below 912 will signal reversal; a rise above 948, continuation.
The primary trend is down; a rise above 954 will signal an up-trend.
The intermediate trend is weak. A fall below 1478 will signal a down-trend; a rise above 1552 will signal continuation.
The index is in a primary up-trend.
Long-term: There are already two bull signals: the March 17 follow through day and the April 3 NYSE Bullish % signal. Wait for confirmation from a Dow/S&P primary trend reversal.
The House of Representatives and Senate leaders reach agreement on a $US 350 billion tax cut. (more)
Advanced sales of TV advertising for the 2003-2004 season are up almost 10%. (more)
New York (16.04): Spot gold retreated to $US 367.60.
On the five-year chart gold has respected the long-term upward trendline.
The intermediate trend is down but on a weak signal.
The primary trend is down. A rise above 3062 will signal an up-trend.
MACD (26,12,9) is below its signal line; Slow Stochastic (20,3,3) has crossed to above; Twiggs Money Flow (21) is rising.
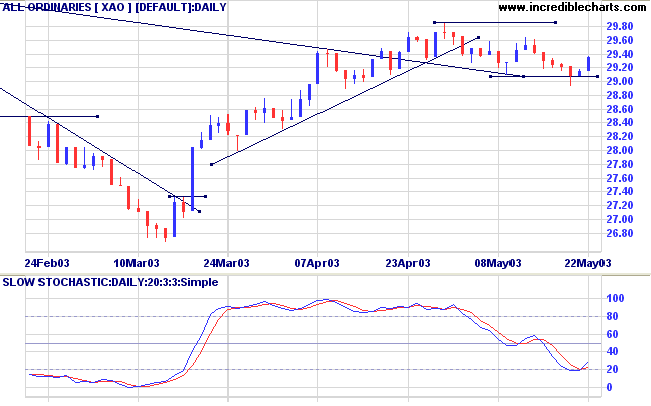
Intermediate: Long if the primary trend reverses up (XAO above 3062); short if the XAO is below 2908.
Long-term: There is already a bull signal: the March 18 follow through. Wait for confirmation from a primary trend reversal.
Last covered on December 19, 2002.
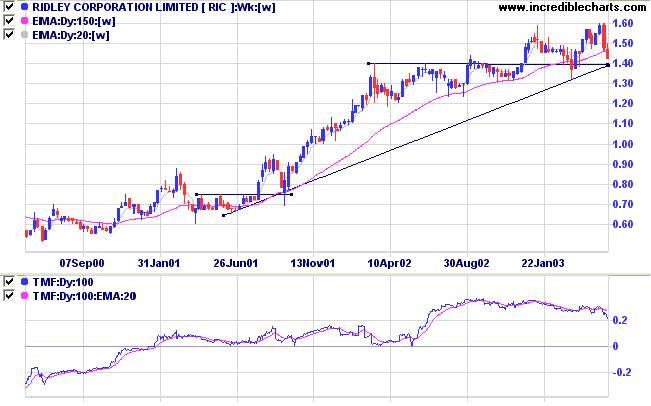
Ridley has been in a stage 2 up-trend for the past 2 years. It has now started a correction after a marginal new high.
Twiggs Money Flow (100) shows a slight bearish divergence after a lengthy period of strong accumulation.
Note the entry points at [a] and [d] on the daily chart: both volume and daily range dried up above the long-term supporting trendline.
The pennant at [b] signaled continuation.
Exits could be taken at [c] and [e] when price penetrated the intermediate trendline.
The marginal high at [f] made a gain of only 1 cent before retreating.
RIC has now reached the supporting trendline; the daily range has narrowed but volume is still high. This is a pivotal point: if price rallies above the long-term trendline we could see another intermediate up-swing.
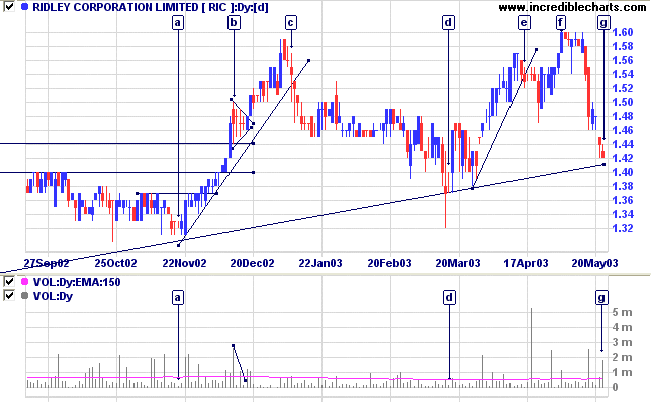
And a fall below 1.32, completing the double top pattern, from [c] to [f], would be a strong bear signal.
It does not do to leave a dragon out
of
your calculations, if you live near him.
- J.R.R. Tolkien, The Hobbit
Click here to access the Trading Diary Archives.
Back Issues

Author: Colin Twiggs is a former investment banker with almost 40 years of experience in financial markets. He co-founded Incredible Charts and writes the popular Trading Diary and Patient Investor newsletters.
Using a top-down approach, Colin identifies key macro trends in the global economy before evaluating selected opportunities using a combination of fundamental and technical analysis.
Focusing on interest rates and financial market liquidity as primary drivers of the economic cycle, he warned of the 2008/2009 and 2020 bear markets well ahead of actual events.
He founded PVT Capital (AFSL No. 546090) in May 2023, which offers investment strategy and advice to wholesale clients.