If you activated your free trial when the Premium version was first introduced,
you may notice that your free trial has expired but that you still have access to Premium data.
We will shortly introduce US indexes and hourly updates for ASX stocks
and the free trial period has been extended to fit in with this.
Trading Diary
May 21, 2003
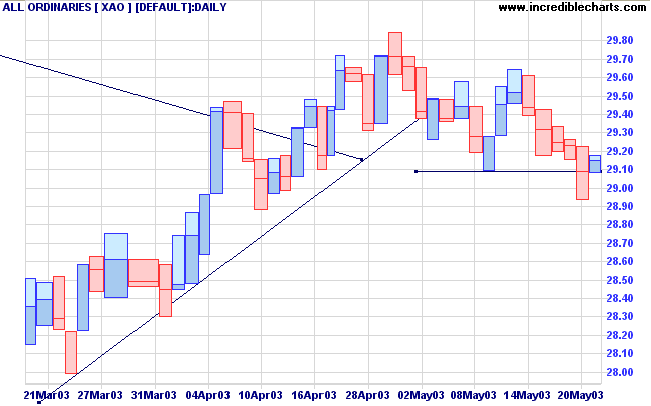
The intermediate upward trendline has been broken. A fall below 8394 will signal a reversal.
The primary trend is down; a rise above 9076 will signal a reversal.
The intermediate upward trend is weakening. A fall below 912 will signal reversal.
The primary trend is down; a rise above 954 will signal an up-trend.
The intermediate trend is weakening. A fall below 1478 will signal a down-trend.
The index is in a primary up-trend.
Long-term: There are already two bull signals: the March 17 follow through day and the April 3 NYSE Bullish % signal. Wait for confirmation from a Dow/S&P primary trend reversal.
The Fed chairman says that production and employment are weak but stronger financial markets and productivity gains point the way to recovery. (more)
New York (18.57): Spot gold has reached $US 371.10.
On the five-year chart gold has respected the long-term upward trendline.
The intermediate trend has reversed downwards but on a weak signal. A false break is often followed by a rally; so traders need to stay alert.
The primary trend is down. A rise above 3062 will signal an up-trend.
MACD (26,12,9) is below its signal line; Slow Stochastic (20,3,3) is below; Twiggs Money Flow (21) is rising.
Intermediate: Long if the primary trend reverses up (XAO above 3062); short if the XAO is below 2908.
Long-term: There is already a bull signal: the March 18 follow through. Wait for confirmation from a primary trend reversal.
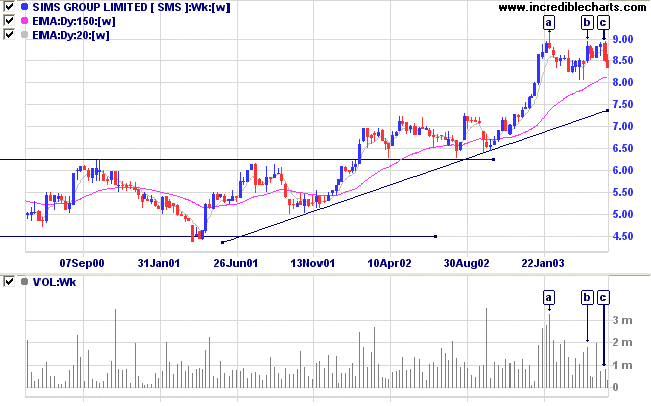
I projected a long-term target of 9.75 on January 2, 2003 on the Chart Forum .
The stock has made healthy gains since then, but now shows signs of weakness. Price made a High at [a] after several weeks of strong volume; and the subsequent correction was accompanied by a dry-up of volume. The next rally to [b] was on lower volume and failed to match the previous High. Another high at [c], on even lower volume, formed a small double top.
A lower double top (after a new high) in an up-trend is a bear signal.
On the daily chart you can see the lower double top completed by a break below the intervening trough at [d].
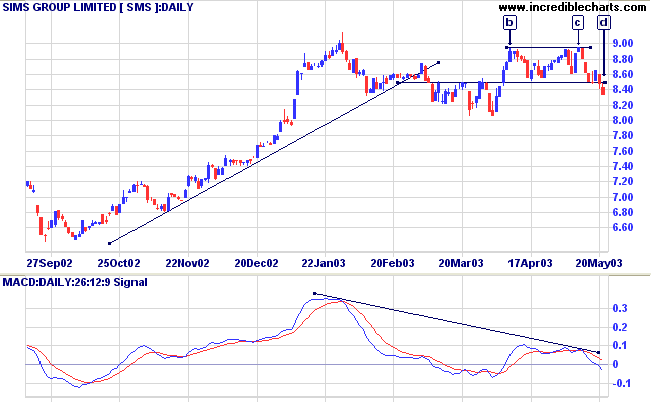
Intermediate traders should not trade against the primary trend, but look to take profits after rallies off the primary trend line (primary trend movements) and re-enter after corrections. Short-term traders are able to place tight stops, above the most recent high at 8.65, and trade the secondary correction back to the long-term trendline.
A break above the high of [c] would be a bull signal.
Absorb what is useful,
reject what is useless,
and add what is specifically your own.
- Bruce Lee
(not exactly intended for traders, but useful advice
nonetheless)
Click here to access the Trading Diary Archives.
Back Issues

Author: Colin Twiggs is a former investment banker with almost 40 years of experience in financial markets. He co-founded Incredible Charts and writes the popular Trading Diary and Patient Investor newsletters.
Using a top-down approach, Colin identifies key macro trends in the global economy before evaluating selected opportunities using a combination of fundamental and technical analysis.
Focusing on interest rates and financial market liquidity as primary drivers of the economic cycle, he warned of the 2008/2009 and 2020 bear markets well ahead of actual events.
He founded PVT Capital (AFSL No. 546090) in May 2023, which offers investment strategy and advice to wholesale clients.