Subscribe by 31 May 2003.
The Daily Trading Diary will only be available to Premium members.
We have extended the cut-off until mid-May - to fit in with the introduction of US charts.
Trading Diary
May 12, 2003
The intermediate trend is up.
The primary trend is down; a rise above 9076 will signal a reversal.
The S&P 500 broke through resistance at 935, closing 12 points up at 945.
The intermediate up-trend continues.
The primary trend is down; a rise above 954 will signal a reversal.
The Nasdaq Composite rallied 1.4% to close at 1541, breaking resistance at 1521.
The intermediate trend is up.
The break above 1521 provides clear confirmation that the index is in a primary up-trend.
The Chartcraft NYSE Bullish % Indicator rose to 57.62% on May 9, following a Bull Correction buy signal on April 3.
Long-term: There are already two bull signals: the March 17 follow through day and the April 3 NYSE Bullish % signal. Wait for confirmation from a Dow/S&P primary trend reversal.
A weaker dollar may make local US manufacturers more competitive, but may also introduce inflation - a double-edged sword. (more)
New York (17.59): Spot gold has climbed to $US 351.00.
On the five-year chart gold has respected the long-term upward trendline.
The intermediate up-trend is weak; a close below Monday's low of 2926 will signal a reversal.
The primary trend is down. A rise above 3062 will signal an up-trend.
MACD (26,12,9) and Slow Stochastic (20,3,3) are below their signal lines and the Stochastic has fallen below 80%, a further bear signal; Twiggs Money Flow (21) is below its trendline but still signals accumulation.
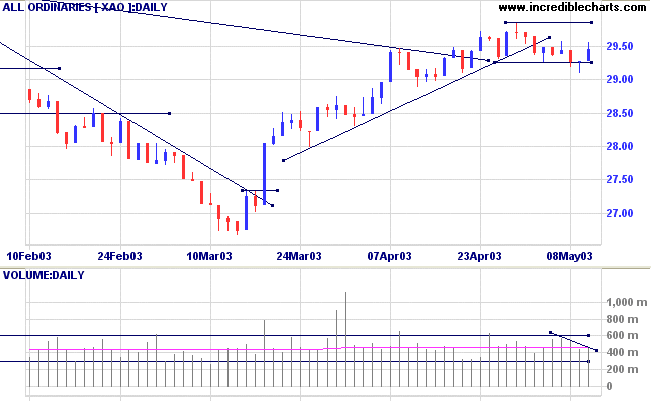
Intermediate: Long if the primary trend reverses up (XAO above 3062); short if the XAO falls below 2919.
Long-term: There is already a bull signal: the March 18 follow through. Wait for confirmation from a primary trend reversal.
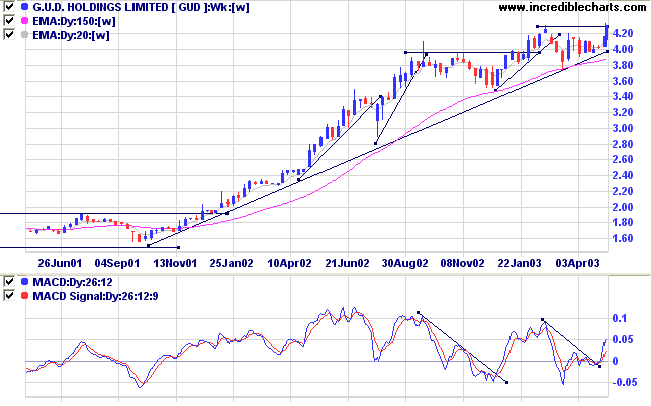
The manufacturer of filtration products, pumps and appliances has maintained a stage 2 up-trend for the last 18 months after breaking out of a broad base. The stock has rallied sharply after the latest correction, closing at a new high of 4.30.
Relative Strength (price ratio: xao) is rising; MACD and Twiggs Money Flow (21-day) are bullish.
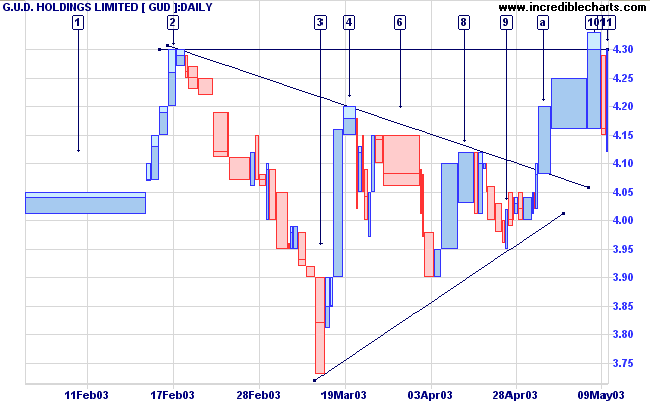
Earlier, the over-square bar at [1] had exhausted buying support, resulting in a weak rally to [2] and a strong correction to [3].
Strong selling was evident at [6] but had dissipated by [8]. The next rally broke above the previous high and carried to the 4.30 resistance level, overcoming selling pressure with strong volume.
The high at [10] failed to break through resistance and we now see a weak correction at [11]. Volume is light and we should see further consolidation, between the high of [8] and resistance at 4.30, before another test of the resistance level.
He who only sees the obvious, wins his
battles with difficulty;
he who looks below the surface of things, wins with ease.
- Sun Tzu: The Art of War.
Click here to access the Trading Diary Archives.
Back Issues

Author: Colin Twiggs is a former investment banker with almost 40 years of experience in financial markets. He co-founded Incredible Charts and writes the popular Trading Diary and Patient Investor newsletters.
Using a top-down approach, Colin identifies key macro trends in the global economy before evaluating selected opportunities using a combination of fundamental and technical analysis.
Focusing on interest rates and financial market liquidity as primary drivers of the economic cycle, he warned of the 2008/2009 and 2020 bear markets well ahead of actual events.
He founded PVT Capital (AFSL No. 546090) in May 2023, which offers investment strategy and advice to wholesale clients.