Subscribe by 31 May 2003.
The Daily Trading Diary will only be available to Premium members.
We have extended the cut-off until mid-May - to fit in with the introduction of US charts.
Trading Diary
May 7, 2003
The intermediate trend is down. I prefer to wait for a clear break above resistance (8600) to signal the start of an up-trend. A fall below 8328 will signal continuation.
The primary trend is down; a rise above 9076 will signal a reversal.
The S&P 500 retreated 5 points to close at 929, forming an inside day.
The slow intermediate up-trend continues, with resistance overhead at 935.
The primary trend is down; a rise above 954 will signal a reversal.
The Nasdaq Composite retreated back below resistance, closing down 1.1% at 1506.
The intermediate trend is up, with resistance overhead at 1521.
The primary trend is up.
The Chartcraft NYSE Bullish % Indicator continues to rise, reaching 56.38% on May 6, following a Bull Correction buy signal on April 3.
Long-term: There are already two bull signals: the March 17 follow through day and the April 3 NYSE Bullish % signal. Wait for confirmation from a Dow/S&P primary trend reversal.
McKinsey & Co report that the 40% fall in the S&P 500 over the past 3 years is attributable to large cap stocks in three major sectors: information technology, telecommunications and materials. Six of the other seven sectors showed positive returns. (more)
Cisco
The network equipment manufacturer reports earnings above expectations, but gives a cautious fourth-quarter outlook. (more)
New York (17.37): Spot gold eased to $US 341.60.
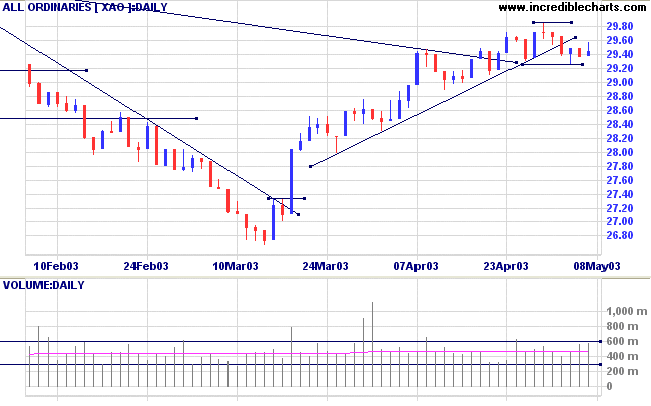
The intermediate up-trend continues but the indicators show that it is weakening; a break below Monday's low of 2926 will signal a reversal.
The primary trend is down. A rise above 3062 will signal reversal to an up-trend.
MACD (26,12,9) and Slow Stochastic (20,3,3) are below their signal lines and the Stochastic has fallen below 80%, a further bear signal; Twiggs Money Flow (21) is below its upward trendline but continues to signal accumulation.
Long-term: There is already a bull signal: the March 18 follow through. Wait for confirmation from a primary trend reversal.
Last covered on July 17, 2002.
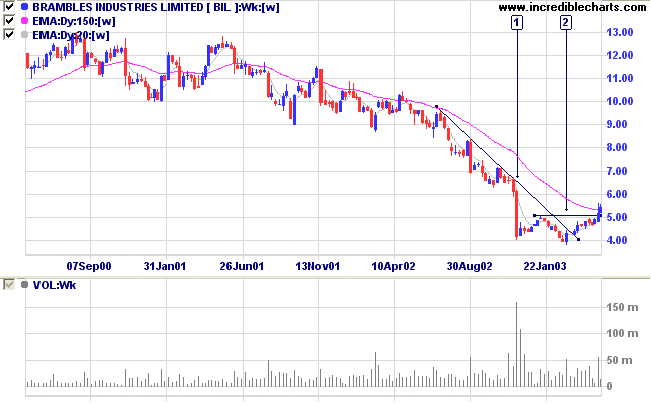
BIL is among several Industrial stocks showing signs of a recovery. After a classic downward spike (selling climax) on heavy volume at [1], Brambles made a false (marginal) break of support at [2], before rallying strongly to complete a double bottom reversal with a break above 5.00.
Twiggs Money Flow (100-day and 21-day) show bullish divergences between [1] and [2].
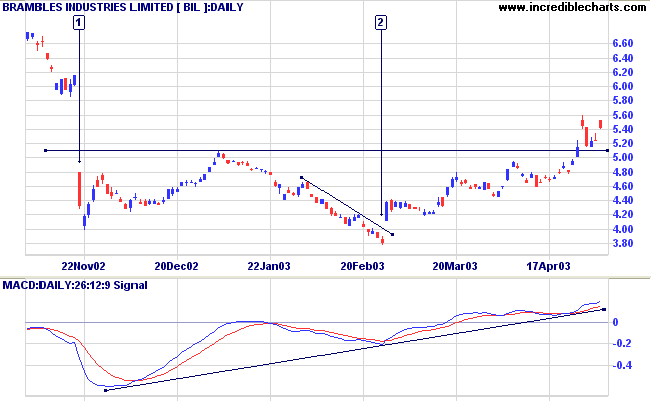
Another significant gap, sometimes referred to as a hole-in-the-wall gap, above the downward trendline at [2], is a strong bull signal.
Relative Strength (price ratio: xao) has leveled after a lengthy decline and MACD shows a bullish divergence at [2].
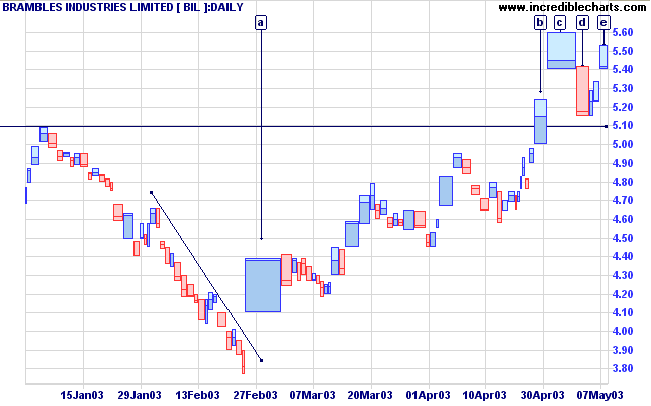
The break above resistance at [b] shows heavy selling pressure, with weak closes at [b] and [c] and strong volume at [c].
The pull-back at [d] only lasted one day but showed significant volume.
The subsequent rally to [e] shows weak closes and thin volume. Expect further consolidation above 5.00
A break below 4.60 would be a bear signal.
The future belongs to those who believe in
the beauty of their dreams.
- Eleanor Roosevelt.
Click here to access the Trading Diary Archives.
Back Issues

Author: Colin Twiggs is a former investment banker with almost 40 years of experience in financial markets. He co-founded Incredible Charts and writes the popular Trading Diary and Patient Investor newsletters.
Using a top-down approach, Colin identifies key macro trends in the global economy before evaluating selected opportunities using a combination of fundamental and technical analysis.
Focusing on interest rates and financial market liquidity as primary drivers of the economic cycle, he warned of the 2008/2009 and 2020 bear markets well ahead of actual events.
He founded PVT Capital (AFSL No. 546090) in May 2023, which offers investment strategy and advice to wholesale clients.