Subscribe by 31 May 2003.
The Daily Trading Diary will only be available to Premium members.
We have extended the cut-off until mid-May - to fit in with the introduction of US charts.
Trading Diary
May 6, 2003
The intermediate trend is down. I prefer to wait for a clear break above resistance (8643) to signal the start of an up-trend. A fall below 8258 will signal continuation.
The primary trend is down; a rise above 9076 will signal a reversal.
The S&P 500 rallied 8 points to close at 934.
The slow intermediate up-trend continues, approaching resistance at 940.
The primary trend is down; a rise above 954 will signal a reversal.
The Nasdaq Composite broke above resistance to set a new 6-month high of 1523; up 1.3% on the day.
The intermediate trend is up.
The primary trend is up.
The Chartcraft NYSE Bullish % Indicator is at 55.25% (May 5), following a Bull Correction buy signal on April 3.
Long-term: There are already two bull signals: the March 17 follow through day and the April 3 NYSE Bullish % signal. Wait for confirmation from a Dow/S&P primary trend reversal.
The Federal Reserve policy meeting decides to leave the overnight lending rate unchanged at the 40-year low of 1.25%; and warns of downside risks. (more)
New York (18.30): Spot gold has climbed to $US 344.00.
The intermediate up-trend continues but the indicators show that it is weakening; a break below Monday's low of 2926 will signal a reversal.
The primary trend is down. A rise above 3062 will signal reversal to an up-trend.
MACD (26,12,9) and Slow Stochastic (20,3,3) are below their signal lines and the Stochastic has fallen below 80%, a further bear signal; Twiggs Money Flow (21) is below its upward trendline but continues to signal accumulation.
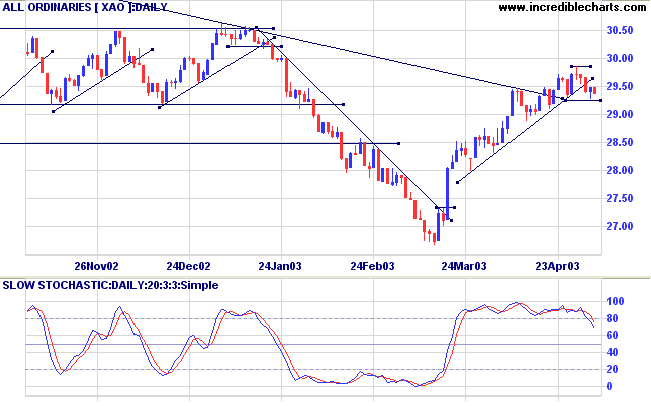
Long-term: There is already a bull signal: the March 18 follow through. Wait for confirmation from a primary trend reversal.
Correction: Yesterday's diary contained a typo - The 21-day Twiggs Money Flow shows a strong bearish divergence.
Last covered on October 18, 2003.
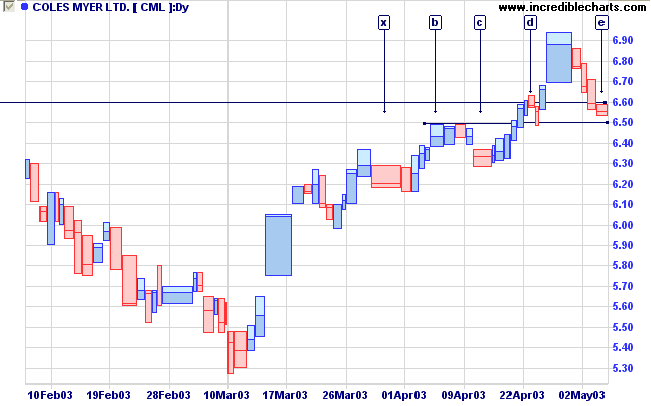
After a sharp downward spike, CML has rallied strongly to a new 6-month high.
Twiggs Money Flow shows a strong bullish divergence at [1], with the trough ending above the zero line.

Later, CML broke above resistance after a short pull-back at [d], but has since corrected to test the new support level at [e].
Relative Strength (price ratio: xao) and MACD are bullish.

A break below 6.50 would be a bear signal.
Everybody is ignorant.
Only on different subjects.
- Will Rogers.
Click here to access the Trading Diary Archives.
Back Issues

Author: Colin Twiggs is a former investment banker with almost 40 years of experience in financial markets. He co-founded Incredible Charts and writes the popular Trading Diary and Patient Investor newsletters.
Using a top-down approach, Colin identifies key macro trends in the global economy before evaluating selected opportunities using a combination of fundamental and technical analysis.
Focusing on interest rates and financial market liquidity as primary drivers of the economic cycle, he warned of the 2008/2009 and 2020 bear markets well ahead of actual events.
He founded PVT Capital (AFSL No. 546090) in May 2023, which offers investment strategy and advice to wholesale clients.