Subscribe by 31 May 2003.
The Daily Trading Diary will only be available to Premium members.
We have extended the cut-off until mid-May - to fit in with the introduction of US charts.
Trading Diary
May 5, 2003
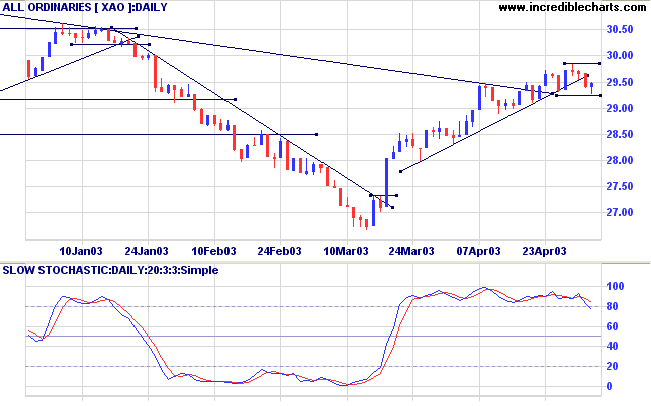
The intermediate trend is down. The index has broken above the upper border of the ascending triangle but immediately retreated. I prefer to wait for a break above Friday's high (8612) to signal the start of an up-trend. A fall below 8109 will signal continuation.
The primary trend is down; a rise above 9076 will signal a reversal.
The S&P 500 closed 4 points down at 926.
The intermediate up-trend continues.
The primary trend is down; a rise above 954 will signal a reversal.
The Nasdaq Composite tested resistance at 1521 then closed back at 1504; 2 points up.
The intermediate trend is up.
The primary trend is up.
The Chartcraft NYSE Bullish % Indicator continues to climb after a Bull Correction buy signal, reaching 54.23% (May 2).
Long-term: There are already two bull signals: the March 17 follow through day and the NYSE Bullish % signal. Wait for confirmation from a Dow/S&P primary trend reversal.
The Federal Reserve is not expected to announce further rate cuts on Tuesday, despite rising unemployment and a manufacturing slow-down. (more)
New York (18.58): Spot gold is up slightly at $US 341.60.
The intermediate up-trend continues but the indicators signal that it is weakening; a break below Monday's low of 2926 will be bearish.
The primary trend is down, although the trendline has been broken; a rise above 3062 will signal a reversal.
MACD (26,12,9) and Slow Stochastic (20,3,3) are below their signal lines; Twiggs Money Flow (21) is below its upward trendline but continues to signal accumulation.
Long-term: There is already a bull signal: the March 18 follow through. Wait for confirmation from a primary trend reversal.
Last covered on December 3, 2002.
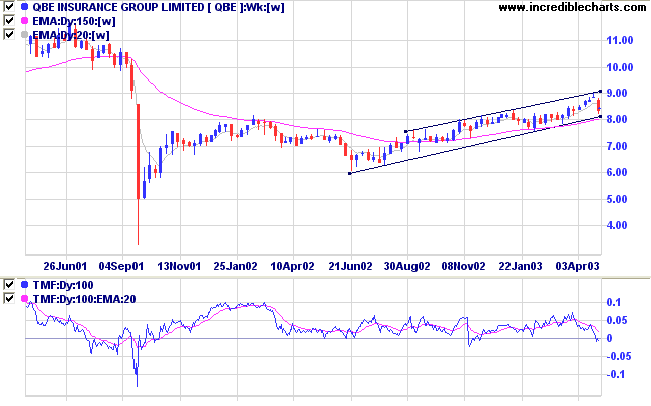
QBE has formed a stage 2 upward trend after a broad base consolidation.
Twiggs Money Flow shows steady accumulation since the disastrous fall in September 2001.
The 21-day Twiggs Money Flow shows a strong bullish divergence.
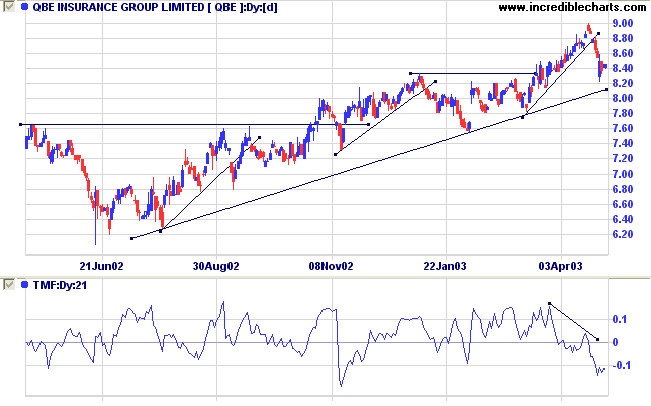
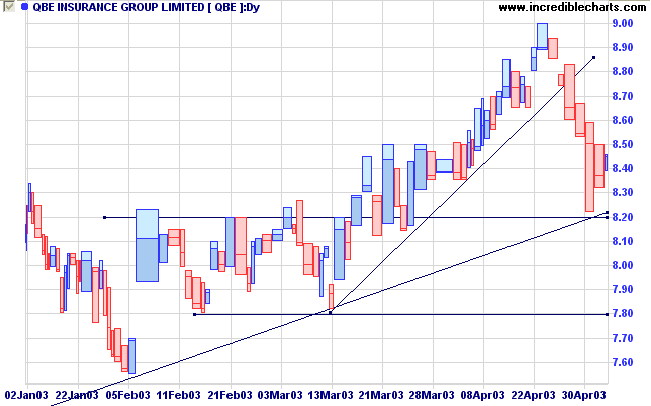
Swing traders will normally seek long entries at an up-turn at the primary trendline. Caution should be exercised because of the strong volume on the last correction: wait for a further test of the supporting trendline and a dry up of volume and volatility at the bottom of the correction.
Don't gamble.
Take all your savings and buy some good stock
and hold it 'til it goes up then sell it.
If it don't go up, don't buy it.
- Will Rogers.
Click here to access the Trading Diary Archives.
Back Issues

Author: Colin Twiggs is a former investment banker with almost 40 years of experience in financial markets. He co-founded Incredible Charts and writes the popular Trading Diary and Patient Investor newsletters.
Using a top-down approach, Colin identifies key macro trends in the global economy before evaluating selected opportunities using a combination of fundamental and technical analysis.
Focusing on interest rates and financial market liquidity as primary drivers of the economic cycle, he warned of the 2008/2009 and 2020 bear markets well ahead of actual events.
He founded PVT Capital (AFSL No. 546090) in May 2023, which offers investment strategy and advice to wholesale clients.