Subscribe by 31 May 2003.
The Daily Trading Diary will only be available to Premium members.
We have extended the cut-off until mid-May - to fit in with the introduction of US charts.
Trading Diary
April 29, 2003
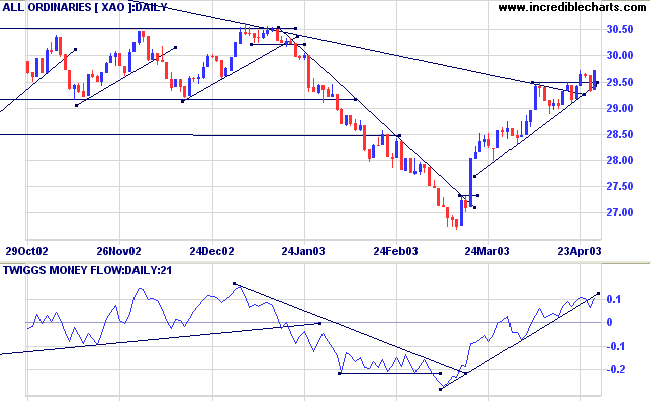
The intermediate trend is down. A rise above 8587 will signal the start of an up-trend; a fall below 8109 will signal continuation.
March 17th's follow through remains valid (as long as the index holds above 7763).
The primary trend is down; a rise above 9076 will signal a reversal.
The Nasdaq Composite rallied 9 points to close at 1471.
The intermediate trend is up; overhead resistance is at 1521.
The primary trend is up.
The S&P 500 continued the intermediate up-trend, gaining 3 points to close at 917.
The primary trend is down; a rise above 954 will signal a reversal.
The Chartcraft NYSE Bullish % Indicator is at 50.98% (April 28), after completing a Bull Correction buy signal.
Long-term: There are already two bull signals: the March 17 follow through day and the NYSE Bullish % signal. Wait for confirmation from a Dow/S&P primary trend reversal.
The Conference Board index of consumer confidence leaped to 81.0 in April, from a low of 61.4 in March. (more)
New York (18.24): Spot gold is up slightly at $US 334.20.
The primary trend is down, although the trendline has been broken; a rise above 3062 will signal a reversal.
MACD (26,12,9) is above its signal line; Slow Stochastic (20,3,3) is below; Twiggs Money Flow (21) has crossed below the upward trendline but continues to signal accumulation.
Long-term: There is already a bull signal: the March 18 follow through. Wait for confirmation from a primary trend reversal.
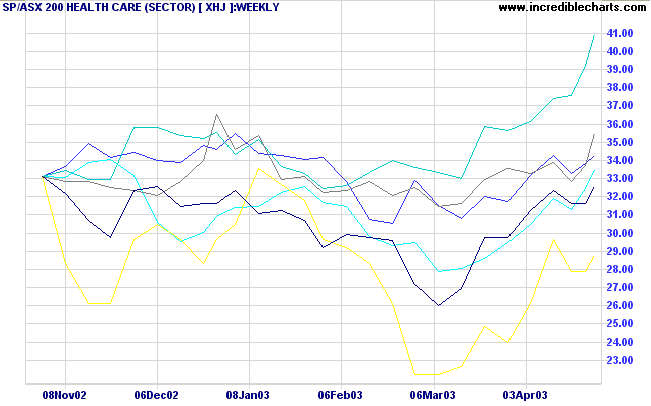
Some Health Care stocks are showing signs of recovery. XHJ is still in stage 4, but sufficient stocks are turning up to warrant close attention.
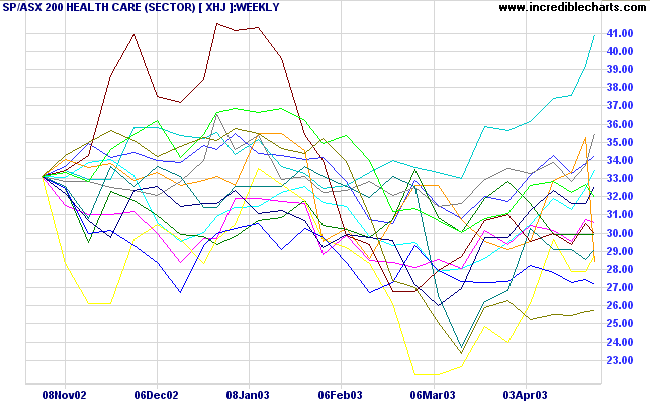
But examine each line closely and you will see that
DCA,
Healthscope,
MIA,
Resmed,
Sigma and
Sonic Healthcare show reversals to an up-trend: a higher low followed by a new high.
The difficulty lies, not in the new
ideas,
but in escaping the old ones, which
ramify,
for those brought up as most of us have been,
into every corner of our minds.
- John Maynard Keynes
Back Issues

Author: Colin Twiggs is a former investment banker with almost 40 years of experience in financial markets. He co-founded Incredible Charts and writes the popular Trading Diary and Patient Investor newsletters.
Using a top-down approach, Colin identifies key macro trends in the global economy before evaluating selected opportunities using a combination of fundamental and technical analysis.
Focusing on interest rates and financial market liquidity as primary drivers of the economic cycle, he warned of the 2008/2009 and 2020 bear markets well ahead of actual events.
He founded PVT Capital (AFSL No. 546090) in May 2023, which offers investment strategy and advice to wholesale clients.