Subscribe by 31 May 2003.
The Daily Trading Diary will be mailed exclusively to Premium members from May 1st.
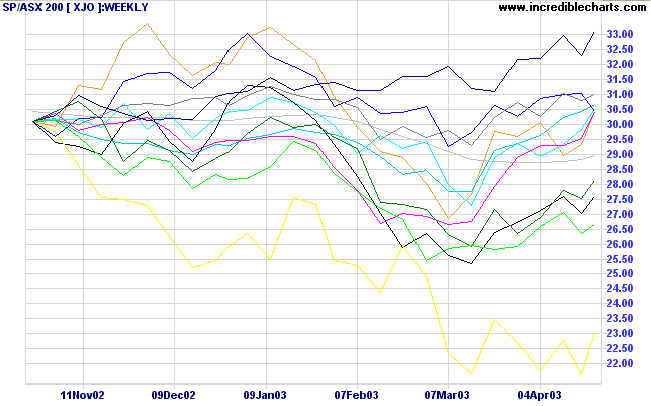
Trading Diary
April 25, 2003
The intermediate trend is down. A rise above 8587 will signal reversal to an up-trend; a fall below 8109 will signal continuation.
March 17th's follow through remains valid (as long as the index holds above 7763).
The primary trend is down; a rise above 9076 will signal a reversal.
The Nasdaq Composite retreated 23 points to close at 1434.
The intermediate trend is up.
The primary trend is up.
The S&P 500 lost 13 points to close at 898.
The intermediate trend is up.
The primary trend is down; a rise above 954 will signal a reversal.
The Chartcraft NYSE Bullish % Indicator is at 50.27% (April 24), after completing a Bull Correction buy signal.
Long-term: There are already two bull signals: the March 17 follow through day and the NYSE Bullish % signal. Wait for confirmation from a Dow/S&P primary trend reversal.
First-quarter GDP grew at 1.6%, barely up on the sluggish fourth-quarter of last year and below expectations. (more)
Consumer sentiment recovers
With the war in Iraq coming to an end, the University of Michigan's index of consumer confidence recovered to 86.0 in April, after a March low of 77.6. (more)
New York (15.00): Spot gold closed the week at $US 333.00.
Long-term: There is already a bull signal: the March 18 follow through day. Wait for confirmation from a primary trend reversal.
Changes are highlighted in bold.
- Energy [XEJ] - stage 4 (RS is level)
- Materials [XMJ] - stage 1 (RS is falling)
- Industrials [XNJ] - stage 4 (RS is falling)
- Consumer Discretionary [XDJ] - stage 1 (RS is level)
- Consumer Staples [XSJ] - stage 1 (RS is rising).
- Health Care [XHJ] - stage 4 (RS is falling)
- Property Trusts [XPJ] - stage 3 (RS is level)
- Financial excl. Property Trusts [XXJ] - stage 1 (RS is rising)
- Information Technology [XIJ] - stage 4 (RS is falling)
- Telecom Services [XTJ] - stage 4 (RS is falling)
- Utilities [XUJ] - stage 2 (RS is rising)
Energy,
Financials (excl. Property),
Consumer Staples and
Consumer Discretionary are recovering.
Industrials,
Health Care and
Telecom are bottoming, while
IT remains weak.
A stock screen of the ASX 200 using % Price Move (1 month: +5%) returned 96 stocks (compared to 131 on April 11, 2003; and 8 on March 14, 2003). The Financial sector is most prominent:
- Banks (7)
- Diversified Financial (7)
- Agricultural Products (4)
- Broadcasting & Cable TV (4)
No man is entitled to the blessings of freedom
unless he be vigilant in its preservation.
- General Douglas MacArthur
Back Issues

Author: Colin Twiggs is a former investment banker with almost 40 years of experience in financial markets. He co-founded Incredible Charts and writes the popular Trading Diary and Patient Investor newsletters.
Using a top-down approach, Colin identifies key macro trends in the global economy before evaluating selected opportunities using a combination of fundamental and technical analysis.
Focusing on interest rates and financial market liquidity as primary drivers of the economic cycle, he warned of the 2008/2009 and 2020 bear markets well ahead of actual events.
He founded PVT Capital (AFSL No. 546090) in May 2023, which offers investment strategy and advice to wholesale clients.