Subscribe by 31 May 2003.
The Daily Trading Diary will be mailed exclusively to Premium members from May 1st.
Trading Diary
April 24, 2003
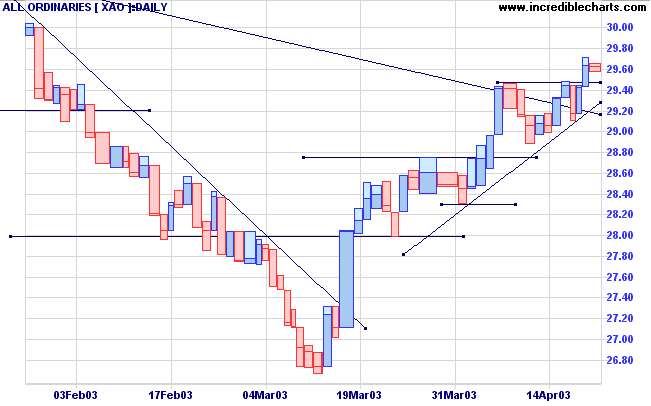
The intermediate trend is down. A rise above 8587 will signal reversal to an up-trend; a fall below 8109 will signal continuation.
March 17th's follow through remains valid (as long as the index holds above 7763).
The primary trend is down; a rise above 9076 will signal a reversal.
The Nasdaq Composite formed an inside day, signaling uncertainty, down 9 points at 1457.
The intermediate trend is up.
The primary trend is up.
The S&P 500 lost 8 points to close at 911.
The intermediate trend is up.
The primary trend is down; a rise above 954 will signal a reversal.
The Chartcraft NYSE Bullish % Indicator is at 50% (April 23), after completing a Bull Correction buy signal.
Long-term: There are already two bull signals: the March 17 follow through day and the NYSE Bullish % signal. Wait for confirmation from a Dow/S&P primary trend reversal.
New unemployment claims jumped to 455,000 for the week ended April 19, signaling contraction. (more)
But durable goods orders increase
A 2% jump in March durable goods orders (1.3% excluding defense items) is welcome news for the manufacturing sector. (more)
New York (19.00): Spot gold is back up to $US 333.60.
The intermediate trend is up.
The primary trend is down; a rise above 3062 will signal a reversal.
MACD (26,12,9) and Slow Stochastic (20,3,3) are above their signal lines; Twiggs Money Flow (21) signals accumulation.
Long-term: There is already a bull signal: the March 18 follow through day. Wait for confirmation from a primary trend reversal.
Last covered on September 2, 2002.
Here is an interesting divergence between two key indicators.
UTB has been in a stage 2 up-trend for the past 3 years, not crossing below its' long-term moving average in the last 18 months.
But notice how Twiggs Money Flow (100-day) has dipped below the zero line, showing a strong bearish divergence just when the general market appears to be strengthening.
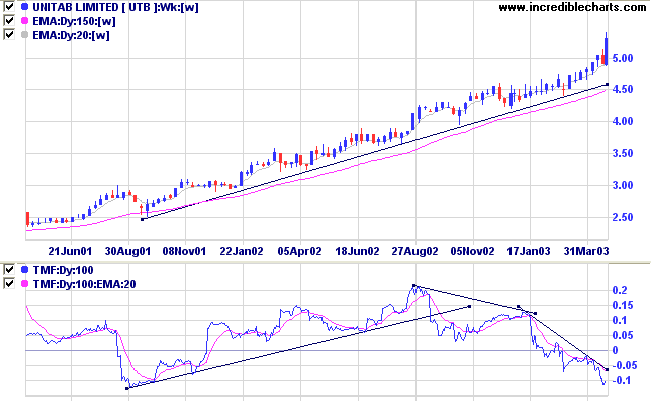
Relative Strength (price ratio: xao) is rising and MACD shows a strong bull signal. Twiggs Money Flow (21) displays the same bearish divergence as the 100-day indicator.
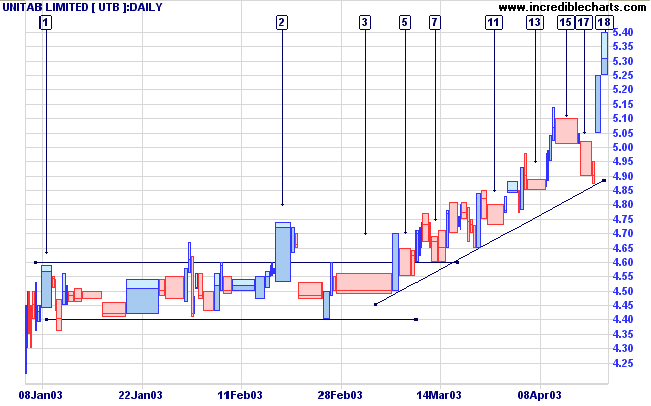
There are a few points worth attention:
- long shadows at [5] and [7] signal accumulation;
- all corrections are of short duration - not more than 4 days;
- down-volume is largest on square bars [11], [13] and [15] - signaling the presence of strong buying support;
- even though down-volume appears dominant, it has not broken the upward trend.
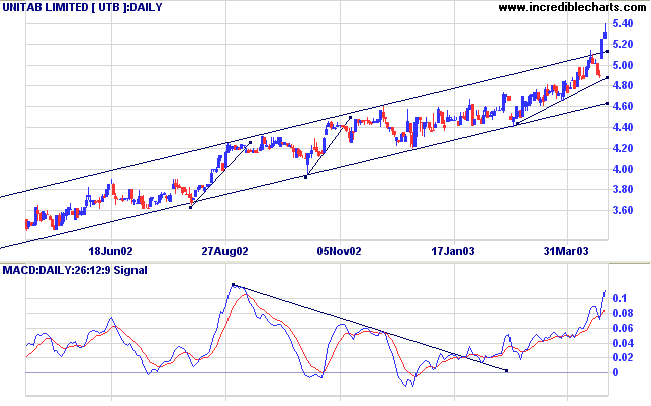
Long-term traders should wait for opportunities at the long-term trendline.
When price is above the upper trend channel traders should lock in profits with tighter stops (or a trailing % stop).
A break below 4.87 (the intermediate trendline) would be bearish.
If you examine their trades,
many failed traders will show a series of small or moderate
gains
and then a few large, devastating losses.
Successful traders may, at times, incur a series of small
losses
but these are then offset by several large gains.
~
Protect the downside and the upside will take care of
itself.
- Donald Trump: The Art of the Deal
Back Issues

Author: Colin Twiggs is a former investment banker with almost 40 years of experience in financial markets. He co-founded Incredible Charts and writes the popular Trading Diary and Patient Investor newsletters.
Using a top-down approach, Colin identifies key macro trends in the global economy before evaluating selected opportunities using a combination of fundamental and technical analysis.
Focusing on interest rates and financial market liquidity as primary drivers of the economic cycle, he warned of the 2008/2009 and 2020 bear markets well ahead of actual events.
He founded PVT Capital (AFSL No. 546090) in May 2023, which offers investment strategy and advice to wholesale clients.