We will continue to provide free charting software and end-of-day data. See Free Resources for details.
Trading Diary
April 23, 2003
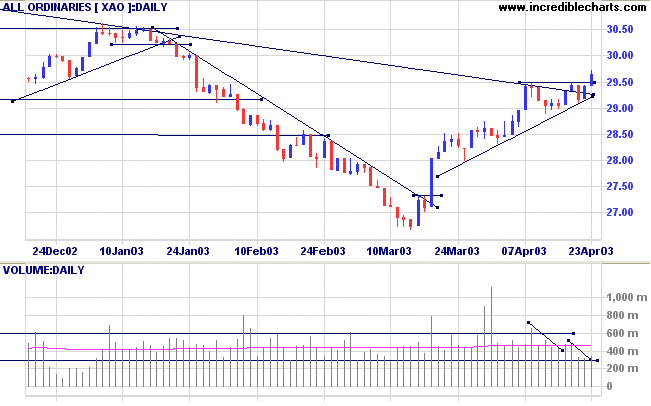
The intermediate trend is down. A rise above 8552 will signal reversal to an up-trend; a fall below 8109 will signal continuation.
March 17th's follow through remains valid (as long as the index holds above 7763).
The primary trend is down; a rise above 9076 will signal a reversal.
The Nasdaq Composite gained 1.0% to close at 1466.
The intermediate trend is in an up-trend.
The primary trend is up.
The S&P 500 climbed a further 9 points to close at 919.
The intermediate trend is in an up-trend.
The primary trend is down; a rise above 954 will signal a reversal.
The Chartcraft NYSE Bullish % Indicator climbed to 50% (April 22), after completing a Bull Correction buy signal.
Long-term: There are already two bull signals: the March 17 follow through day and the NYSE Bullish % signal. Wait for confirmation from a Dow/S&P primary trend reversal.
There is a widely-held view that the market is ranging, but is this correct? (more)
New York (17.36): Spot gold eased to $US 330.90.
The intermediate trend is up.
The primary trend is down; a rise above 3062 will signal a reversal.
MACD (26,12,9) and Slow Stochastic (20,3,3) are above their signal lines; Twiggs Money Flow (21) signals accumulation.
Long-term: There is already a bull signal: the March 18 follow through day. Wait for confirmation from the primary trend reversal.
Last covered on December 13, 2002.
Several stocks in the Casinos & Gaming sector have started trending upwards.
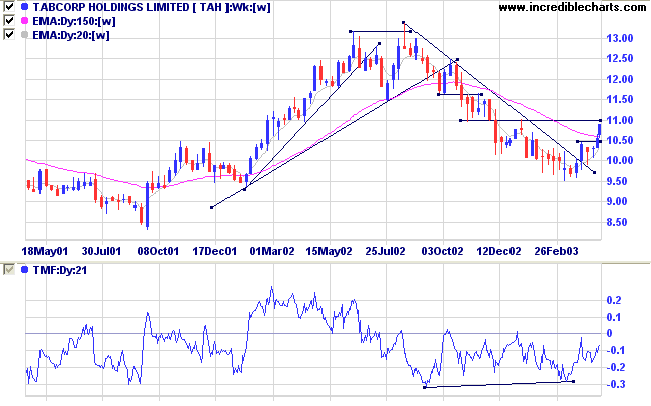
The weekly chart shows that TAH has broken above its long-term downward trendline. The primary trend will reverse up if price breaks above resistance at 10.90.
Twiggs Money Flow (100-day) signals distribution, but the 21-day indicator shows a strong bullish divergence.
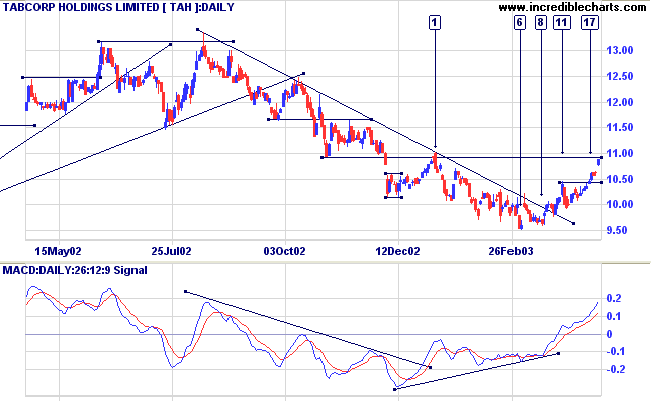
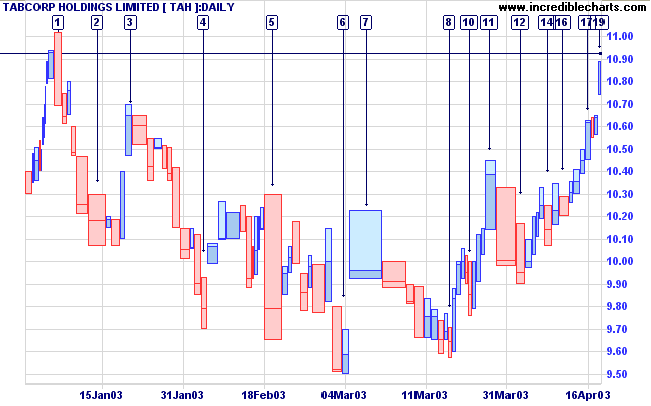
A pull-back below resistance at 10.93 may present opportunities for short-term traders. Long entries can be taken on a short duration pull-back with light volume.
A fall below 10.40 would be bearish.
Our plans miscarry because they have no aim.
When a man does not know what harbor he is making for,
no wind is the right wind.
- Seneca.
Back Issues

Author: Colin Twiggs is a former investment banker with almost 40 years of experience in financial markets. He co-founded Incredible Charts and writes the popular Trading Diary and Patient Investor newsletters.
Using a top-down approach, Colin identifies key macro trends in the global economy before evaluating selected opportunities using a combination of fundamental and technical analysis.
Focusing on interest rates and financial market liquidity as primary drivers of the economic cycle, he warned of the 2008/2009 and 2020 bear markets well ahead of actual events.
He founded PVT Capital (AFSL No. 546090) in May 2023, which offers investment strategy and advice to wholesale clients.