The Daily Trading Diary will be mailed exclusively to Premium members from May 1st.
Trading Diary
April 22, 2003
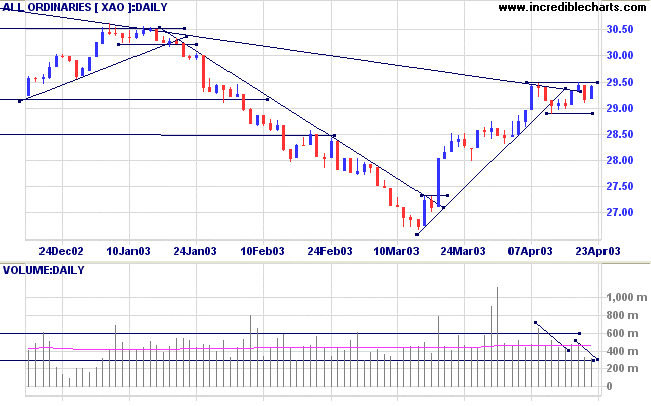
The intermediate trend is down. A rise above 8552 will signal reversal to an up-trend; a fall below 8109 will signal continuation.
March 17th's follow through remains valid (as long as the index holds above 7763).
The primary trend is down; a rise above 9076 will signal a reversal.
The Nasdaq Composite rallied 1.9% to close at 1451.
The break above 1430 signals that the intermediate trend is in an up-trend.
The primary trend is up.
The S&P 500 rallied 19 points to close at 911, signaling that the intermediate trend has reversed to an up-trend.
The primary trend is down; a rise above 954 will signal a reversal.
The Chartcraft NYSE Bullish % Indicator is at 48% (April 18), after completing a Bull Correction buy signal.
Long-term: There are already two bull signals: the March 17 follow through day and the NYSE Bullish % signal. Wait for confirmation from a Dow/S&P primary trend reversal.
President Bush supports Alan Greenspan for another term as Chairman of the Federal Reserve. (more)
eBay
The Internet auction company posts first-quarter earnings of 32 cents a share, more than double last year. more)
New York (18.22): Spot gold eased to $US 332.90.
MACD (26,12,9) and Slow Stochastic (20,3,3) are above their signal lines; Twiggs Money Flow (21) signals accumulation.
Long-term: There is already a bull signal: the March 18 follow through day. Wait for confirmation from the primary trend reversal.
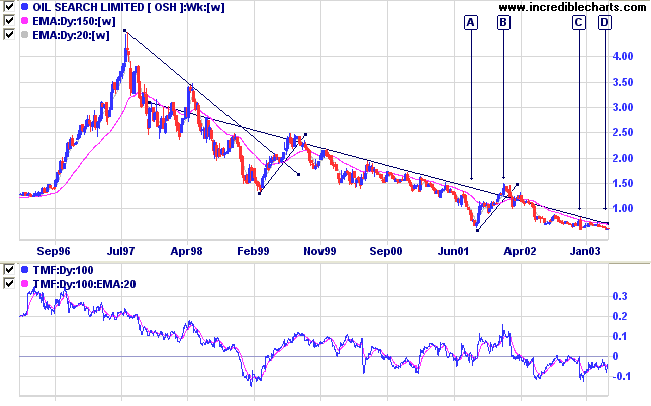
A reader asked if I foresee an up-turn in OSH.
The weekly chart shows a long-term down-trend. Note the V-bottom at [A] which broke the trendline before failing at [B] and eventually re-testing support at [C]. The stock now shows equal lows at [C] and [D].
Twiggs Money Flow (100-day) signals distribution, hanging below the zero line.
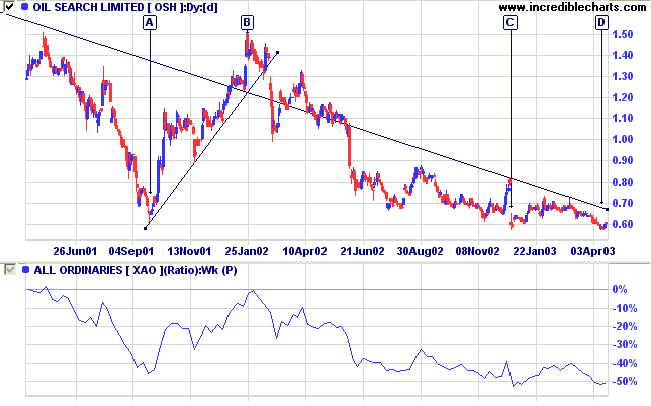
Relative Strength (price ratio: xao) is well below zero and, despite equal lows at [C] and [D], shows no signs of an up-trend.
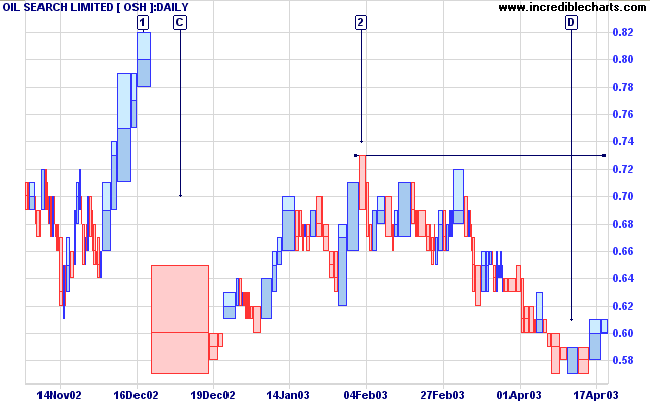
But equal lows in a down-trend are a weak signal. Only a rise above resistance at [2] will signal a bullish reversal.
It may be prudent to wait even longer: until a pull-back after the breakout - to support at 0.73.
A fall below 0.57 would be a bear signal.
Good judgment comes from experience,
and a lot of that comes from bad judgment.
- Will Rogers.
Back Issues

Author: Colin Twiggs is a former investment banker with almost 40 years of experience in financial markets. He co-founded Incredible Charts and writes the popular Trading Diary and Patient Investor newsletters.
Using a top-down approach, Colin identifies key macro trends in the global economy before evaluating selected opportunities using a combination of fundamental and technical analysis.
Focusing on interest rates and financial market liquidity as primary drivers of the economic cycle, he warned of the 2008/2009 and 2020 bear markets well ahead of actual events.
He founded PVT Capital (AFSL No. 546090) in May 2023, which offers investment strategy and advice to wholesale clients.