Select Time Period >> Chart Complete Data to view 10 years data.
Trading Diary
April 21, 2003
The intermediate trend is down. A rise above 8552 will signal reversal to an up-trend; a fall below 8109 will signal continuation.
Monday 17th's follow through remains valid (as long as the index holds above 7763).
The primary trend is down.
The Nasdaq Composite lost 1 point to close at 1424.
The intermediate trend is down. A rise above 1430 will signal a reversal; a fall below 1351 will signal continuation.
The primary trend is up.
The S&P 500 also closed down 1 point at 892.
The intermediate trend is down; a fall below 862 will signal continuation, a rise above 904 will signal reversal.
The primary trend is down.
The Chartcraft NYSE Bullish % Indicator rose to 48% (April 18), after completing a Bull Correction buy signal.
Long-term: There are already two bull signals: the March 17 follow through day and the NYSE Bullish % signal. Wait for confirmation from a Dow/S&P primary trend reversal.
The first Iraqi refinery moves back into production. Crude prices edge above $31 per barrel as Opec cuts back to avoid a glut. (more)
New York (19.04): Spot gold climbed steadily to $US 333.40.
Long-term: There is already a bull signal: the March 18 follow through day. Wait for confirmation from the primary trend reversal.
Last covered on April 8, 2003.
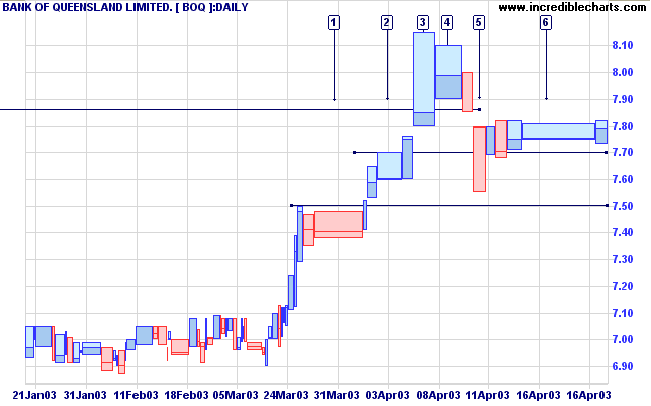
BOQ recently made a new high but then experienced a pull-back below resistance at 7.86. The pull-back encountered support at 7.70 with a long shadow at [5]. Price has since consolidated between 7.70 and 7.82 with big volume signaling accumulation at [6].
If you find yourself in a hole, the first thing to do is stop
diggin'.
- Will Rogers.
Back Issues

Author: Colin Twiggs is a former investment banker with almost 40 years of experience in financial markets. He co-founded Incredible Charts and writes the popular Trading Diary and Patient Investor newsletters.
Using a top-down approach, Colin identifies key macro trends in the global economy before evaluating selected opportunities using a combination of fundamental and technical analysis.
Focusing on interest rates and financial market liquidity as primary drivers of the economic cycle, he warned of the 2008/2009 and 2020 bear markets well ahead of actual events.
He founded PVT Capital (AFSL No. 546090) in May 2023, which offers investment strategy and advice to wholesale clients.