Please check under Help >> About to ensure that you have received the update.
Select the Free Trial button on the toolbar for a 30-day free trial of the Full Member version.
With the exception of the Trading Diary, the existing Free Resources will continue.
From May 1st, the daily Trading Diary will be mailed exclusively to Premium members. The weekend edition, with an overview of sectors and markets, will still be available to all members.
Troubleshooting: see Version 4.0.2.0 on the Chart Forum.
Trading Diary
April 16, 2003
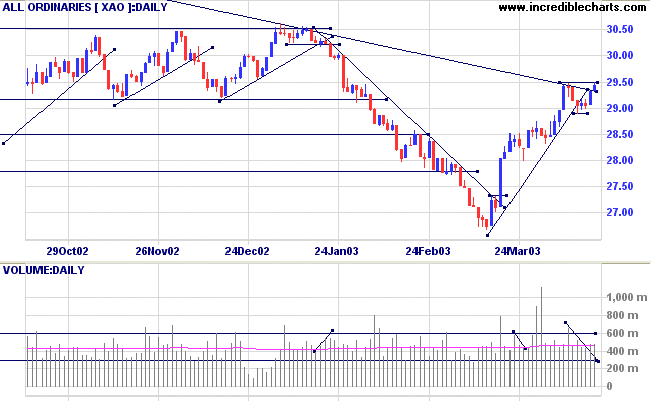
The intermediate trend is down. A rise above 8552 will signal reversal to an up-trend; a fall below 8109 will signal continuation.
Monday 17th's follow through remains valid (as long as the index holds above 7763).
The primary trend is down.
The Nasdaq Composite displayed a strong open-close reversal signal below resistance at 1430. The close was up 0.3% at 1394.
The intermediate trend is down. A rise above the equal highs at 1430 will signal a reversal; a fall below 1351 will signal continuation.
The primary trend is up.
The S&P 500 formed a key reversal below resistance at 904, closing down 11 points at 879.
The intermediate trend is down; a fall below 862 will signal continuation, a rise above 904 will signal reversal.
The primary trend is down.
The Chartcraft NYSE Bullish % Indicator is at 46% (April 15), after completing a Bull Correction buy signal.
Long-term: There are already two bull signals: the March 17 follow through day and the NYSE Bullish % signal. Wait for confirmation from a Dow/S&P primary trend reversal.
A downgrade by Legg Mason, citing poor earnings quality, caused Coke to fall by more than 6%. Tobacco giant Altria, formerly Philip Morris, reported first-quarter earnings of $1.07, against $1.09 a year earlier, causing a 2% drop. (more)
Tech stocks
Tech stocks were affected by disappointing results from Sun Microsystems, AMD and Apple. (Sun)(AMD)(Apple)
New York (18.58): Spot gold has rallied to $US 326.80.
The intermediate up-trend continues. The trendline has been broken; so we should be alert for signs of a reversal.
The primary trend is down.
Slow Stochastic (20,3,3) has crossed to above its signal line; MACD (26,12,9) is above its signal line; Twiggs Money Flow (21) signals accumulation.
Long-term: There is already a bull signal: the March 18 follow through day. Wait for confirmation from the primary trend reversal.
Last mentioned on December 12, 2002.
AMP has broken above its high at [C] commencing an intermediate up-trend.
Relative Strength (price ratio: xao) is falling; but Twiggs Money Flow (100) is rising.
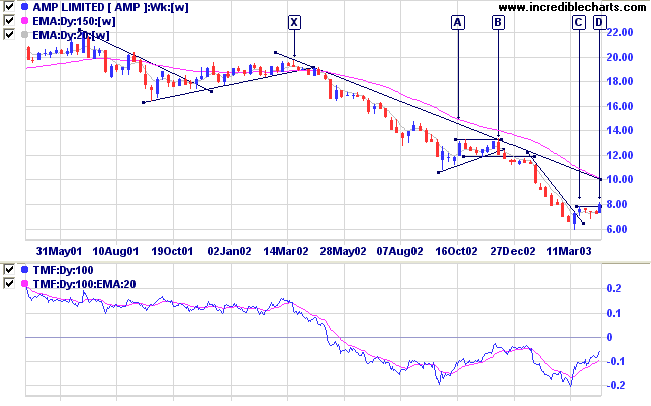
MACD and Twiggs Money Flow (21) are bullish.
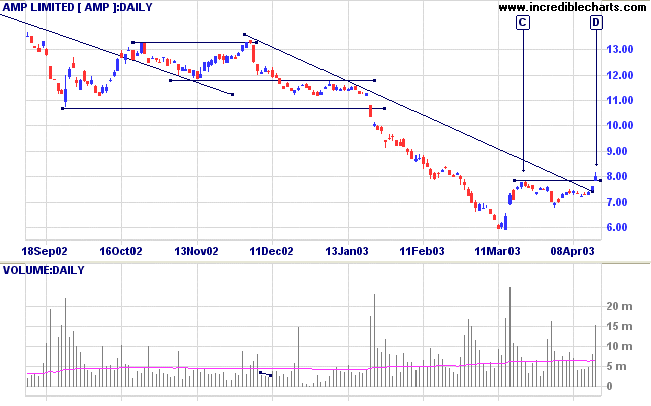
V-bottoms: This is an extension of the theory for support/resistance levels.
Stockholders who bought at higher levels are more inclined to sell when the stock starts to recover, creating resistance.
This is only negated when sufficient stock has passed into the hands of new owners. New stockholders who bought at lower prices will be more bullish and less inclined to sell when prices rise. Hence a breakout from a broad base is more likely to succeed -- there is a large body of stockholders who bought at low prices.
All religions, arts and sciences are branches of the same
tree.
All these aspirations are directed toward ennobling man's
life,
lifting it from the sphere of mere physical
existence
and leading the individual towards freedom.
- Albert Einstein.
Back Issues

Author: Colin Twiggs is a former investment banker with almost 40 years of experience in financial markets. He co-founded Incredible Charts and writes the popular Trading Diary and Patient Investor newsletters.
Using a top-down approach, Colin identifies key macro trends in the global economy before evaluating selected opportunities using a combination of fundamental and technical analysis.
Focusing on interest rates and financial market liquidity as primary drivers of the economic cycle, he warned of the 2008/2009 and 2020 bear markets well ahead of actual events.
He founded PVT Capital (AFSL No. 546090) in May 2023, which offers investment strategy and advice to wholesale clients.