Please check under Help >> About to ensure that you have received the update.
When the free trial is activated, the charts will no longer display the Raw Data watermark.
Trading Diary
April 15, 2003
The intermediate trend is down. A rise above 8552 will signal reversal to an up-trend; a fall below 7903 will signal continuation.
Monday 17th's follow through remains valid (as long as the index holds above 7763).
The primary trend is down.
The Nasdaq Composite gained 0.4% to close at 1391.
The intermediate trend is down. A rise above the equal highs at 1430 will signal a reversal; a fall below 1336 will signal continuation.
The primary trend is up.
The S&P 500 closed up 5 points at 890.
The intermediate trend is down, until the index breaks above 904.
The primary trend is down.
The Chartcraft NYSE Bullish % Indicator is at 46% (April 14), after completing a Bull Correction buy signal.
Long-term: There are already two bull signals: the March 17 follow through day and the NYSE Bullish % signal. Wait for confirmation from a Dow/S&P primary trend reversal.
Industrial production fell a sharp 0.5% in March, according to the Federal Reserve, after a 0.1% fall in February. (more)
Intel
Intel reports first-quarter earnings of 14 cents a share, against expectations of 12 cents. (more)
New York (20.50): Spot gold is down at $US 323.40.
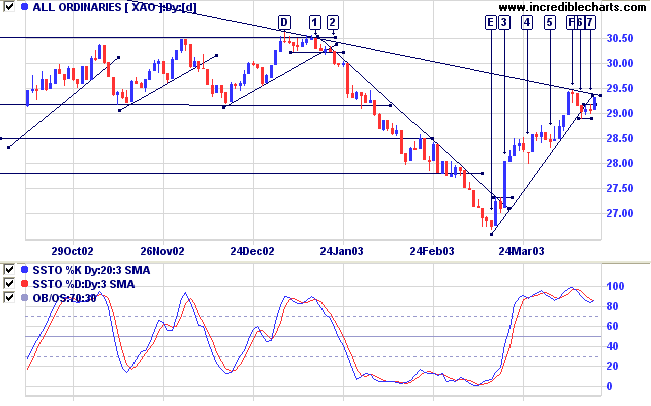
The intermediate up-trend continues. The index is testing the long-term downward trendline and the intermediate trendline has been broken; so we should be alert for signs of a reversal.
The primary trend is down.
Slow Stochastic (20,3,3) has crossed to above its signal line; MACD (26,12,9) is above its signal line; Twiggs Money Flow (21) signals accumulation.
Long-term: There is already a bull signal: the March 18 follow through day. Wait for confirmation from the primary trend reversal.
Last mentioned on March 25, 2003.
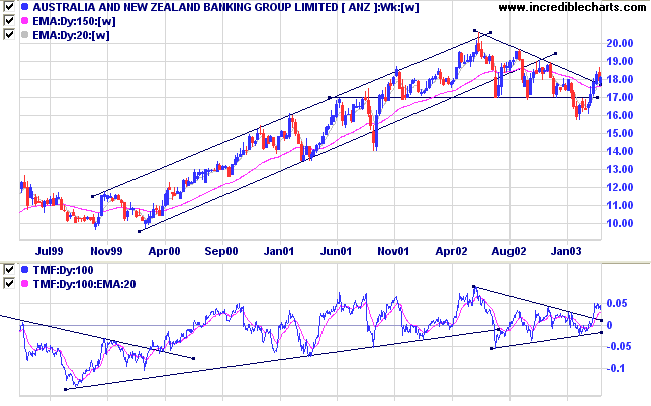
In February 2003 ANZ broke downwards from a stage 3 descending triangle which had formed after a long up-trend.
This turned out to be a bear trap, with price breaking back above resistance at 17.00 and penetrating the upper border of the triangle.
Relative Strength (price ratio: xao) is rising; Twiggs Money Flow (100) shows accumulation after a bullish divergence.
MACD and Twiggs Money Flow (21) are bullish.
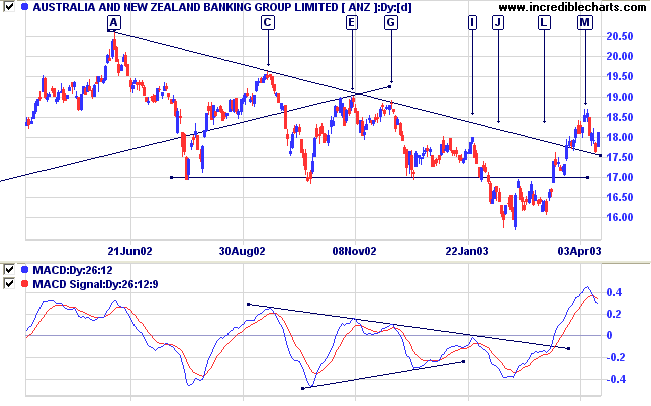
A break below 17.60 would be bearish.
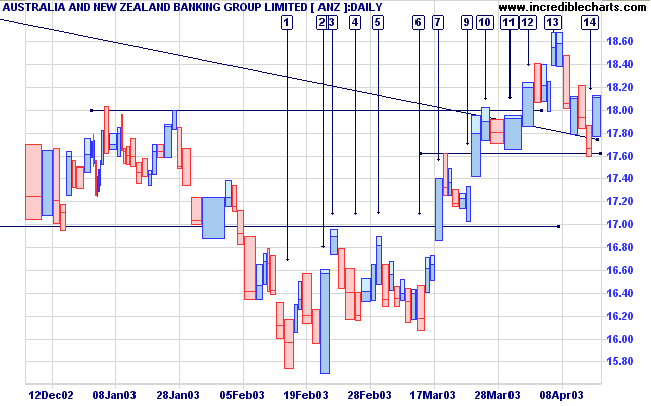
- The double bottom at [1] and [2];
- The strong upward bar at [2];
- The double bottom at [4] and [6], higher than the earlier pattern;
- Strong volume on the break above resistance at [7];
- Light volume on the pull-back that respected the support level at [9] - a strong bull signal;
- Strong volume on subsequent up days;
- The correction to [11] respects support from the previous high.
The key to success in most sports is to perform the basics
better than anyone else:
study each movement; break it down into its component parts;
and practice until you master it.
The same holds true for trading stocks.
Back Issues

Author: Colin Twiggs is a former investment banker with almost 40 years of experience in financial markets. He co-founded Incredible Charts and writes the popular Trading Diary and Patient Investor newsletters.
Using a top-down approach, Colin identifies key macro trends in the global economy before evaluating selected opportunities using a combination of fundamental and technical analysis.
Focusing on interest rates and financial market liquidity as primary drivers of the economic cycle, he warned of the 2008/2009 and 2020 bear markets well ahead of actual events.
He founded PVT Capital (AFSL No. 546090) in May 2023, which offers investment strategy and advice to wholesale clients.