Please check under Help >> About to ensure that you have received the update.
-
Select the Free
Trial button on the toolbar for a
30-day free trial of the Full Member version.
Several users encountered difficulties with the free trial activation. They should now have access.
Trading Diary
April 14, 2003
The intermediate trend is down. A rise above 8552 will signal a reversal to an up-trend; a fall below 7903 will signal continuation.
Monday 17th's follow through remains valid (as long as the index holds above 7763).
The primary trend is down.
The Nasdaq Composite gained 1.9% to close at 1384.
The intermediate trend is down. A rise above the equal highs at 1430 will signal a reversal; a fall below 1336 will signal continuation.
The primary trend is up.
The S&P 500 rallied strongly to close up 17 points at 885.
The intermediate trend is down, until the index breaks above 904.
The primary trend is down.
The Chartcraft NYSE Bullish % Indicator is at 46% (April 11), after completing a Bull Correction buy signal.
Long-term: There are already two bull signals: the March 17 follow through day and the NYSE Bullish % signal. Wait for confirmation from a Dow/S&P primary trend reversal.
IBM and Microsoft lead a tech stock rally. (more)
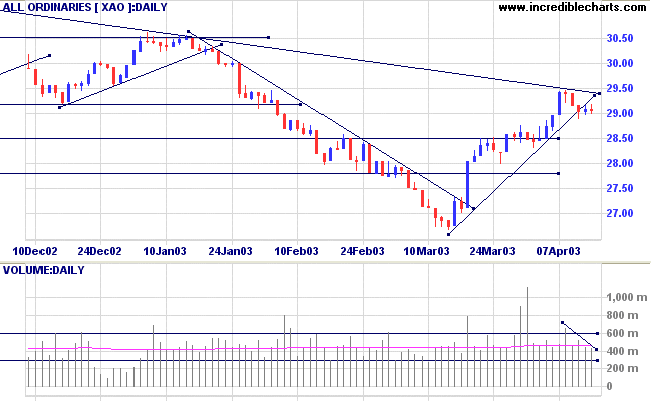
New York (18.36): Spot gold is down at $US 324.40.
The intermediate up-trend continues, but the upward trendline has been broken; so we need to be alert for signs of weakness.
The primary trend is down.
MACD (26,12,9) is above its signal line; Slow Stochastic (20,3,3) is below; Twiggs Money Flow (21) signals accumulation.

Long-term: There is already a bull signal: the March 18 follow through day. Wait for confirmation from the primary trend reversal.
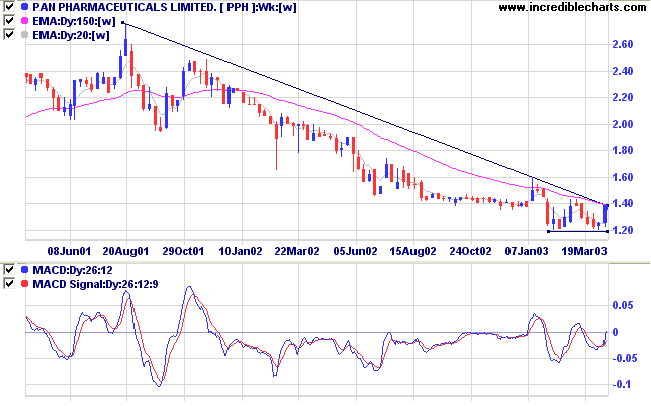
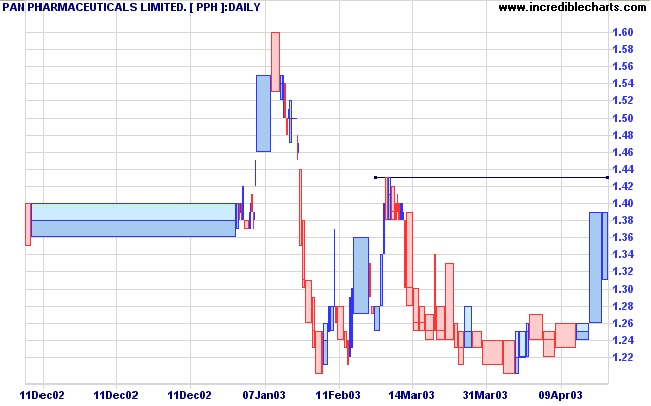
Pan is one of several Health Care stocks in the ASX 200 that are forming a stage 1 base. The stock also threatens to break above its long-term downward trendline.
Relative Strength (price ratio: xao) has leveled; MACD shows a bullish divergence; Twiggs Money Flow (21) shows distribution.

The weak Twiggs Money Flow warns us to be cautious. There may still be another re-test of support at 1.20.

Most of us have the will to win,
but few have the will to prepare to win.
- Bill McLaren, quoting an American Football coach.
Back Issues

Author: Colin Twiggs is a former investment banker with almost 40 years of experience in financial markets. He co-founded Incredible Charts and writes the popular Trading Diary and Patient Investor newsletters.
Using a top-down approach, Colin identifies key macro trends in the global economy before evaluating selected opportunities using a combination of fundamental and technical analysis.
Focusing on interest rates and financial market liquidity as primary drivers of the economic cycle, he warned of the 2008/2009 and 2020 bear markets well ahead of actual events.
He founded PVT Capital (AFSL No. 546090) in May 2023, which offers investment strategy and advice to wholesale clients.
