|
|
|
WineOrb, Australia’s premium fine wine
broker, are offering a free Masterclass for you and your
partner, to show you what to look for when making an
investment in wine. Complete the form on our site and tell us
in less than 25 words why you would like to attend. The best
entries will be invited to join us at the Masterclass on the
16th May 2003. Click here to enter. |
Trading Diary
April 9, 2003
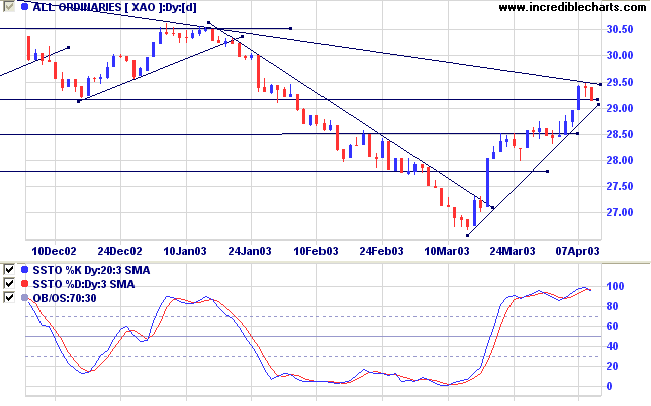
The intermediate trend is down. A rise above the recent equal highs at 8552 will signal reversal to an up-trend; a fall below 7903 will signal continuation.
Monday 17th's follow through signal remains valid (as long as the index holds above 7763).
The primary trend is down.
The Nasdaq Composite fell 1.9% to 1356.
The intermediate trend is down. A rise above the equal highs at 1430 will signal a reversal; a fall below 1336 will signal continuation.
The primary trend is up.
The S&P 500 lost 12 points to close at 865.
The intermediate trend is down, until the index breaks above 904.
The primary trend is down.
The Chartcraft NYSE Bullish % Indicator is at 46% (April 8), after completing a Bull Correction buy signal.
Iraqi Information Minister Mohammed Saeed al-Sahaf failed to appear for his daily briefing; a clear sign that his government has lost control of Baghdad. (more)
News Corp
News Corp acquires a controlling stake in DirecTV; a key step in their strategy to build a global satellite TV network. (more)
New York (18.17): Spot gold is up at $US 326.10.
The intermediate up-trend continues. The strength of the latest correction (volume, duration and volatility) will indicate whether the trend is likely to continue.
The primary trend is down.
MACD (26,12,9) is above its signal line; Slow Stochastic (20,3,3) has crossed to below its signal line; Twiggs Money Flow (21) signals accumulation.
Long-term: There are already two bull signals: the March 18 follow through and April 3 Bullish % signal. Wait for confirmation from the primary trend reversal.
Last covered on March 5, 2003.
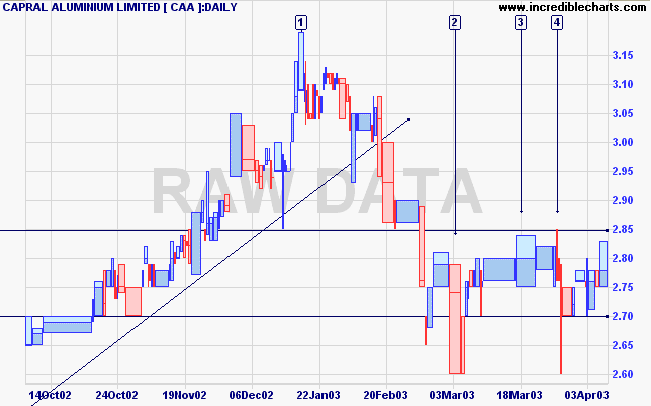
After establishing a broad base CAA broke out in May 2002 to commence a creeping up-trend. In February 2003 the stock broke its upward trendline and threatened to re-test support at 1.80. But price has held above support at 2.60 for more than a month and Twiggs Money Flow (100-day) shows a bullish divergence.
Relative Strength (price ratio: xao) shows short-term weakness, while MACD is rising.
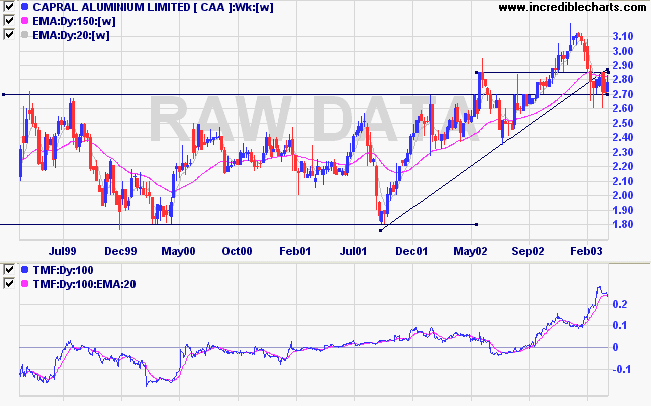
A break below 2.60 would be a bear signal.
Nothing in the world
is as soft and yielding as water.
Yet for dissolving the hard and inflexible,
nothing can surpass it.
The soft overcomes the hard;
the gentle overcomes the rigid.
Everyone knows this is true,
but few can put it into practice.
- Lao Tse.
Back Issues

Author: Colin Twiggs is a former investment banker with almost 40 years of experience in financial markets. He co-founded Incredible Charts and writes the popular Trading Diary and Patient Investor newsletters.
Using a top-down approach, Colin identifies key macro trends in the global economy before evaluating selected opportunities using a combination of fundamental and technical analysis.
Focusing on interest rates and financial market liquidity as primary drivers of the economic cycle, he warned of the 2008/2009 and 2020 bear markets well ahead of actual events.
He founded PVT Capital (AFSL No. 546090) in May 2023, which offers investment strategy and advice to wholesale clients.