We should have the free trial available next week.
The free trial period will be extended until 31 May 2003.
Trading Diary
April 4, 2003
Monday 17th's follow through signal remains valid (as long as the index holds above 7763).
The intermediate cycle is down; a rise above 8552 will signal a reversal.
The primary trend is down.
The Nasdaq Composite lost 1% to close at 1383.
The intermediate trend is down; a rise above 1425 will signal a reversal.
The primary trend is up.
The S&P 500 edged up 2 points to close at 878.
The intermediate trend is down, until the index breaks above 895.
The primary trend is down.
The Chartcraft NYSE Bullish % Indicator has reversed upwards to 44% (April 3), completing a Bull Correction buy signal.
Oil prices fall as coalition forces make further progress. Brent Crude is down 4% at $24.45 per barrel. (more)
Unemployment
The market remains focused on the war and shrugged off weak employment figures. (more)
New York (15.30): Spot gold closed at $US 325.20.
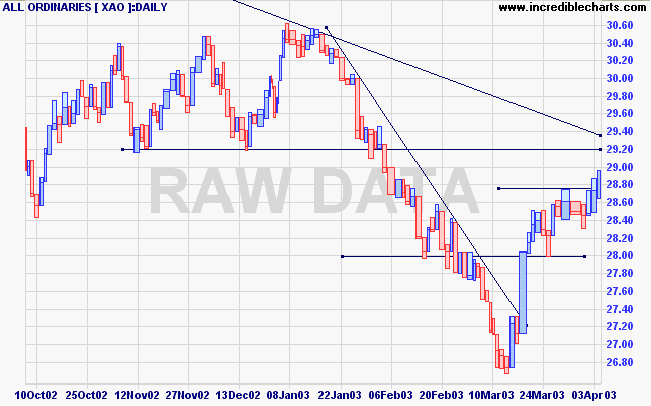
The intermediate up-trend continues, but a lack of volume on the last bar indicates that the latest rally is tentative.
The primary trend is down.
MACD (26,12,9) is above its signal line; Slow Stochastic (20,3,3) crossed to above its signal line; Twiggs Money Flow (21) signals distribution.

Long-term: Wait for the March 18 follow through to be confirmed by the intermediate signal.
Changes are highlighted in bold.
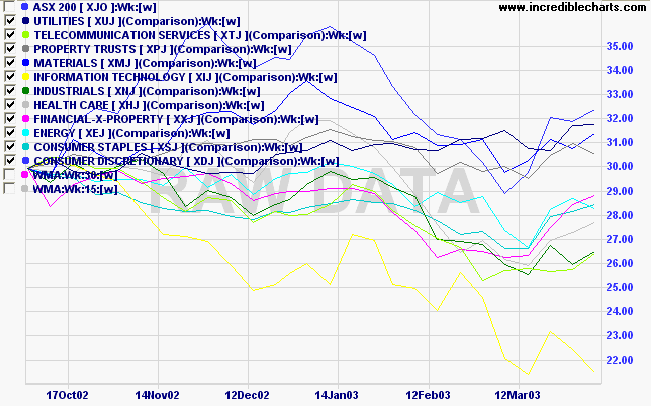
- Energy [XEJ] - stage 4 (RS is falling)
- Materials [XMJ] - stage 2 (RS is rising)
- Industrials [XNJ] - stage 4 (RS is falling)
- Consumer Discretionary [XDJ] - stage 1 (RS is level)
- Consumer Staples [XSJ] - stage 4 (RS is level)
- Health Care [XHJ] - stage 4 (RS is falling)
- Property Trusts [XPJ] - stage 3 (RS is falling)
- Financial excl. Property Trusts [XXJ] - stage 4 (RS is rising)
- Information Technology [XIJ] - stage 4 (RS is falling)
- Telecom Services [XTJ] - stage 4 (RS is falling)
- Utilities [XUJ] - stage 2 (RS is rising)

A stock screen of the ASX 200 using % Price Move (1 month: +5%) returned 67 stocks (compared to 99 on August 23, 2002; and 8 on March 14, 2003). Banks were most prominent:
- Banks (8)
- REITs (5)
- Diversified Metals & Mining (4)
- Agricultural Products (3)
- Broadcasting & TV (3)
- Diversified Commercial (3)
- Diversified Financial (3)
For further guidance see Understanding the Trading Diary.
The better part of valor is discretion.
- William Shakespeare: Henry IV.
Back Issues

Author: Colin Twiggs is a former investment banker with almost 40 years of experience in financial markets. He co-founded Incredible Charts and writes the popular Trading Diary and Patient Investor newsletters.
Using a top-down approach, Colin identifies key macro trends in the global economy before evaluating selected opportunities using a combination of fundamental and technical analysis.
Focusing on interest rates and financial market liquidity as primary drivers of the economic cycle, he warned of the 2008/2009 and 2020 bear markets well ahead of actual events.
He founded PVT Capital (AFSL No. 546090) in May 2023, which offers investment strategy and advice to wholesale clients.
