Explains how to use the [Sectors ASX 200] project file
and how to set up Sector Comparison charts.
Trading Diary
March 24, 2003
The intermediate cycle is down, although the trendline has been broken.
The primary trend is down.
The Nasdaq Composite gapped downwards to close at 1369.
The intermediate trend is down, despite the large correction.
The primary trend is up.
The S&P 500 plummeted to 864, down 31 points.
The intermediate trend is down, but the trendline has been broken.
The primary trend is down.
The Chartcraft NYSE Bullish % Indicator remains at 36% (March 21).
The yield on 10-year treasury notes fell to 3.97% from 4.10% on Friday. The US dollar fell to $1.0638 per euro. (more)
New York (17.25): Spot gold is up 370 cents at $US 329.20.
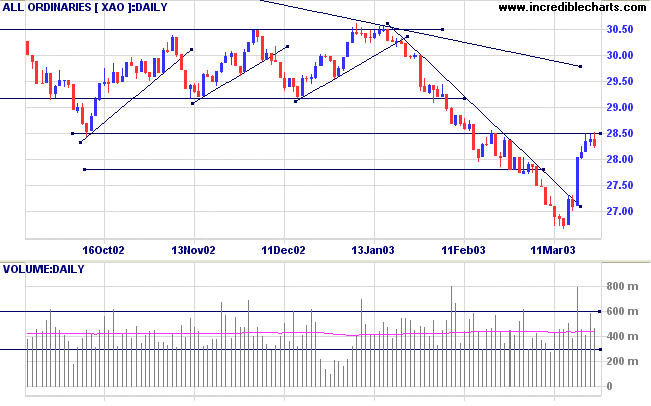
The intermediate trend is down, despite the break above the trendline.
The primary trend is down.
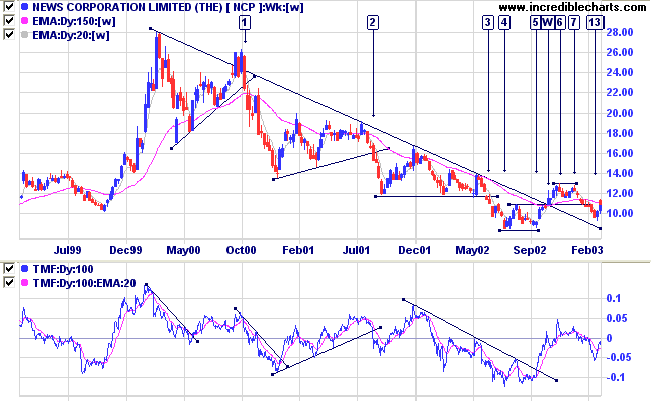
MACD (26,12,9) is above its signal line; Slow Stochastic (20,3,3) is above; Twiggs Money Flow (21) signals distribution.

Last covered on February 24, 2003.
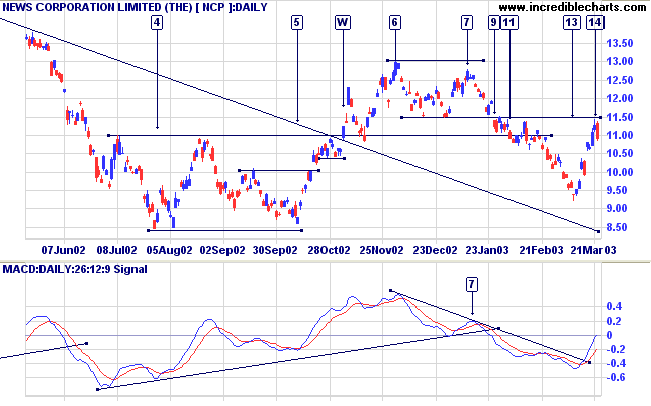
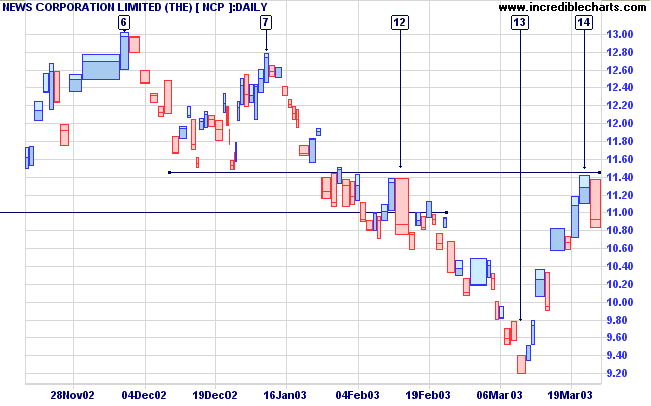
After a long stage 4 down-trend NCP formed a narrow double bottom at [4] and [5] before breaking the downward trendline at [W]. The breakout weakened after equal highs at [6] and [7], retreating to test support at [13].
100-day Twiggs Money Flow has formed a higher trough but is still below zero.

MACD has just crossed into positive territory while 21-day Twiggs Money Flow is still negative.


For further guidance see Understanding the Trading Diary.
Alice: Which road do I take?
Cheshire Cat: Where do you want to go?
Alice: I don't know.
Cheshire Cat: Then... it doesn't matter.
- Lewis Carroll: Alice in Wonderland.
Back Issues

Author: Colin Twiggs is a former investment banker with almost 40 years of experience in financial markets. He co-founded Incredible Charts and writes the popular Trading Diary and Patient Investor newsletters.
Using a top-down approach, Colin identifies key macro trends in the global economy before evaluating selected opportunities using a combination of fundamental and technical analysis.
Focusing on interest rates and financial market liquidity as primary drivers of the economic cycle, he warned of the 2008/2009 and 2020 bear markets well ahead of actual events.
He founded PVT Capital (AFSL No. 546090) in May 2023, which offers investment strategy and advice to wholesale clients.
