Explains how to use the [Sectors ASX 200] project file
and how to set up Sector Comparison charts.
Trading Diary
March 19, 2003
Monday's follow-through day is a reversal signal used by William O'Neil to pick market bottoms.
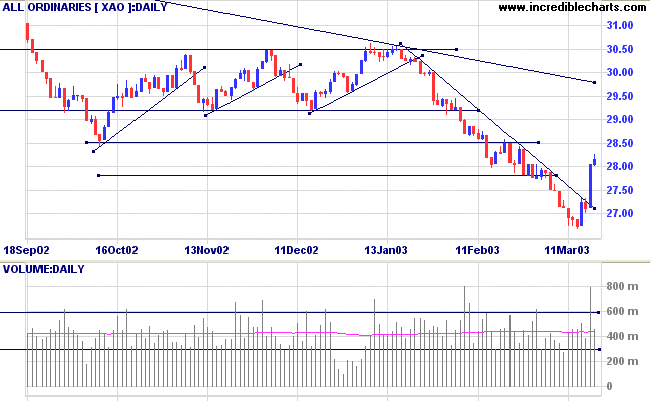
The intermediate cycle is down; until a higher low is formed, followed by a new high.
The primary trend is down.
The Nasdaq Composite eased 3 points lower at 1397.
The large correction does not alter the intermediate trend, which is still down.
The primary trend is up; a fall below 1108 will signal a reversal.
The S&P 500 recorded a similar gain to the Dow, closing 8 points up at 874.
The intermediate trend is down.
The primary trend is down; the next support level is at 768.
The Chartcraft NYSE Bullish % Indicator remains at 36% (March 18), signaling that the latest rally is concentrated on a few stocks and lacks breadth.
Oil prices have fallen 21% in the last 5 days in expectation of a quick war. (more)
The latest rally
The market is pricing in a quick and painless war, but institutions are staying on the sidelines. (more)
New York (16.50): Spot gold is down 100 cents at $US 336.20.
The intermediate trend is down but the index has broken above the trendline.
The primary trend is down.
MACD (26,12,9) is above its signal line; Slow Stochastic (20,3,3) is above; Twiggs Money Flow (21) is rising.
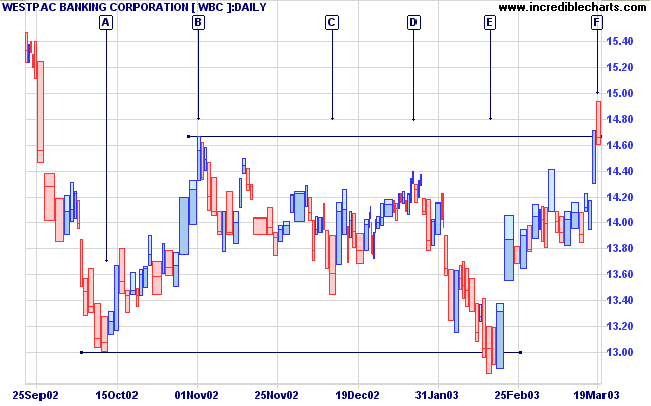
Last covered on November 8, 2002.
WBC appears to have completed a double bottom on the weekly chart, with a break above the intervening high of [B].
Previously the bank had formed a broad top in 2001/2002 before commencing a stage 4 down-trend.
Relative Strength (price ratio: xao) is rising; MACD and Twiggs Money Flow display bullish divergences at [A] and [E].
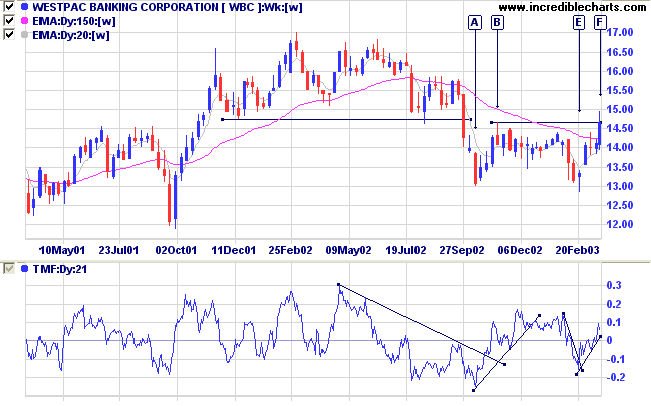
Earlier, the V-bottom at [A] was followed by a sharp rally to [B]. The subsequent shake-out ended with a false break below 13.00 at [E].
False breaks often result in a retreat to test the opposite limit of the trading pattern. Volume and volatility should provide further clues in the next few days, as to what will follow the latest false break at [F].
The screen reflects a number of stocks in consolidations that may prove to be tops.
Apart from the three banks mentioned earlier in the week, 100-day Twiggs Money Flow is bullish for Coates [COA], QBE and Sigma [SIG]; while OPSM, Burns Philp [BPC] and Foodland [FOA] are bearish.
For further guidance see Understanding the Trading Diary.
One of the most helpful things that anybody can learn
is to give up trying to catch the last eighth - or the
first.
These two are the most expensive eighths in the world.
- Edwin Lefevre: Reminiscences of a Stock Operator.
Back Issues

Author: Colin Twiggs is a former investment banker with almost 40 years of experience in financial markets. He co-founded Incredible Charts and writes the popular Trading Diary and Patient Investor newsletters.
Using a top-down approach, Colin identifies key macro trends in the global economy before evaluating selected opportunities using a combination of fundamental and technical analysis.
Focusing on interest rates and financial market liquidity as primary drivers of the economic cycle, he warned of the 2008/2009 and 2020 bear markets well ahead of actual events.
He founded PVT Capital (AFSL No. 546090) in May 2023, which offers investment strategy and advice to wholesale clients.