Explains how to use the [Sectors ASX 200] project file
and how to set up Sector Comparison charts.
Trading Diary
March 18, 2003
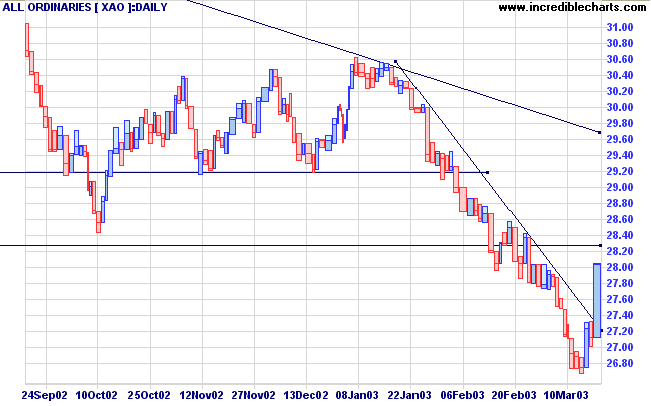
The intermediate cycle is down; until a higher low is formed, followed by a new high.
The primary trend is down.
The Nasdaq Composite rose 8 points to close at 1400.
The large correction does not alter the intermediate trend, which is still down.
The primary trend is up; a fall below 1108 will signal a reversal.
The S&P 500 closed up 4 points at 866.
The intermediate trend is down.
The primary trend is down; the next support level is at 768.
The Chartcraft NYSE Bullish % Indicator is still at 36% (March 17).
The Federal Reserve decides to leave rates unchanged at 1.25%, expressing uncertainty about the effect of the war. Their undertaking to "closely monitor" the economy increases the likelihood of an adjustment before the next policy meeting. (more)
New York (16.50): Spot gold is up 200 cents at $US 338.50.
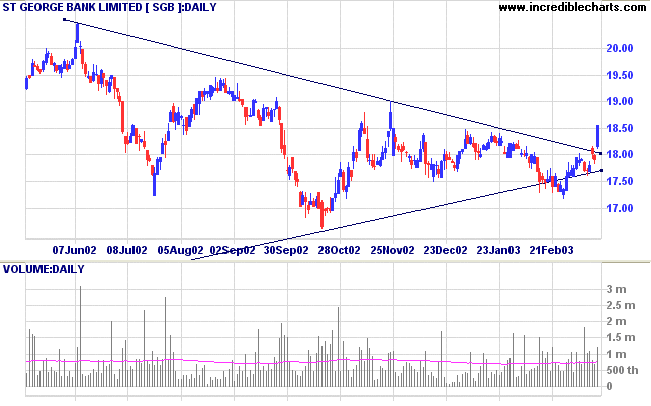
MACD (26,12,9) has crossed to above its signal line; Slow Stochastic (20,3,3) is above; Twiggs Money Flow (21) is rising.
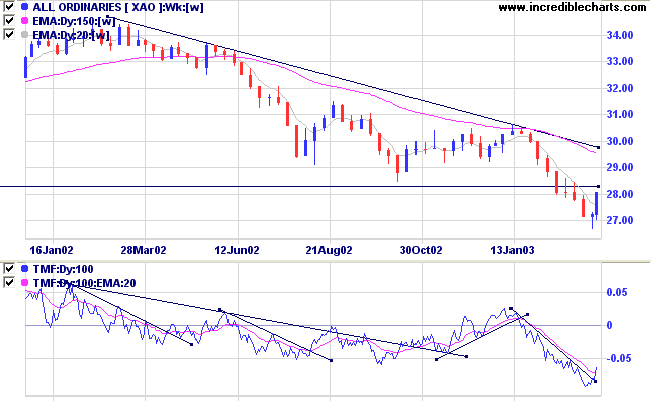
Twiggs Money Flow (100) shows a break of the intermediate trendline.
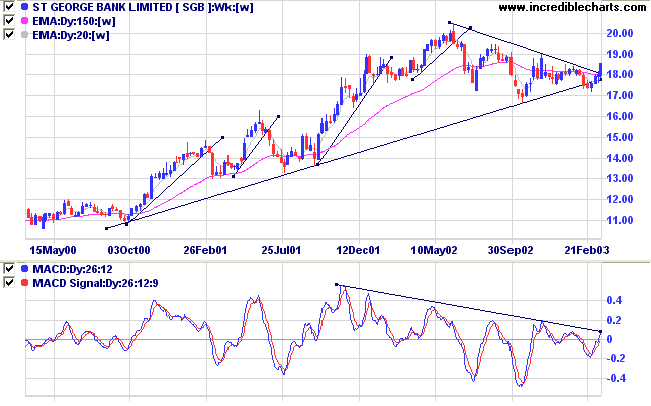
Last covered on October 14, 2002.
SGB started a stage 3 top in 2002, in the form of a triangle. The stock has twice tested the long-term trendline and retreated into positive territory, before the latest upward breakout from the triangle.
Relative Strength (price ratio: xao) is rising; MACD is positive, threatening to break above the downward trendline; and Twiggs Money Flow displays a bullish trough above zero.
Coles Myer and NCP showed high volatility and volume. CML tests its' long-term downward trendline.
Bullish crossovers in the ASX 200 included three banks: WBC, BOQ and SGB.
For further guidance see Understanding the Trading Diary.
All that is necessary for the triumph of evil
is that good men do nothing.
- attributed to Edmund Burke, 18th century British statesman.
Back Issues

Author: Colin Twiggs is a former investment banker with almost 40 years of experience in financial markets. He co-founded Incredible Charts and writes the popular Trading Diary and Patient Investor newsletters.
Using a top-down approach, Colin identifies key macro trends in the global economy before evaluating selected opportunities using a combination of fundamental and technical analysis.
Focusing on interest rates and financial market liquidity as primary drivers of the economic cycle, he warned of the 2008/2009 and 2020 bear markets well ahead of actual events.
He founded PVT Capital (AFSL No. 546090) in May 2023, which offers investment strategy and advice to wholesale clients.