The new Premium data will include market statistics:
New Highs/Lows, Advances/Declines and Advance/Decline Volume.
Trading Diary
March 13, 2003
The primary trend is down.
The Nasdaq Composite gapped up 4.8% to close at 1340.
The intermediate trend is down, with the next support level at 1200.
The primary trend is up; a fall below 1108 will signal a reversal.
The S&P 500 was up 27 points at 831.
The intermediate trend is down.
The primary trend is down; the next support level is at 768.
The Chartcraft NYSE Bullish % Indicator fell to 36% (March 12).
The UN Security Council vote is postponed until next week.
The US government depicts Saddam Hussein's regime as fragile, disclosing that some elements of the Iraqi military are "secretly" negotiating surrender terms. (more)
Bargain-hunters focused on tech stocks, with Microsoft, IBM and Dell showing strong gains. (more)
February retail sales fell 1.6%, the biggest drop in non-auto sales since September 2001. (more)
New York (16.16): Spot gold dropped more than 12 dollars to $US 334.00.
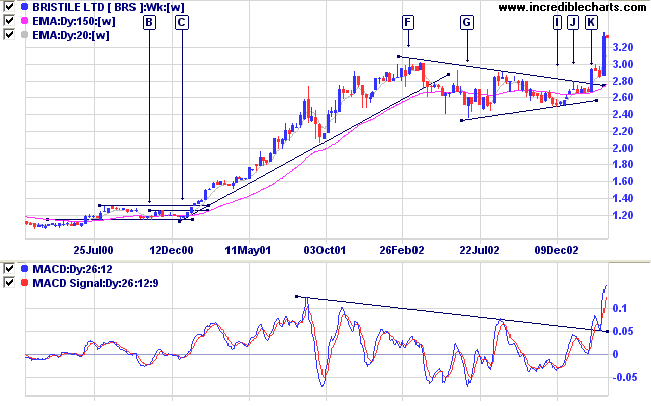
Construction Materials sector is still relatively strong, with only ABC showing recent weakness. BRS, on the other hand, has broken above a large symmetrical triangle and is making new highs.
On the weekly chart we can see that BRS respected the support level, from an earlier breakout, at [B] and [C]. The stock then entered a stage 2 up-trend before a large consolidation, starting at [F], in the form of a symmetrical triangle. Bear in mind that, in a bull market, more than 50% of consolidations do not resolve as stage 3 tops but as continuation patterns in an up-trend. The percentage is obviously lower in a bear market. We can study the consolidation pattern for clues as to whether this is a top:
- Volume tends to be heavier on tops than on continuations;
- Volume dries up during a continuation pattern, not during a top;
- A continuation pattern is likely to slope downward, regaining energy;
- Tops continually attempt to overcome a strong resistance level, expending energy.
Twiggs Money Flow has not yet given a clear bull signal, retreating back towards the zero line.
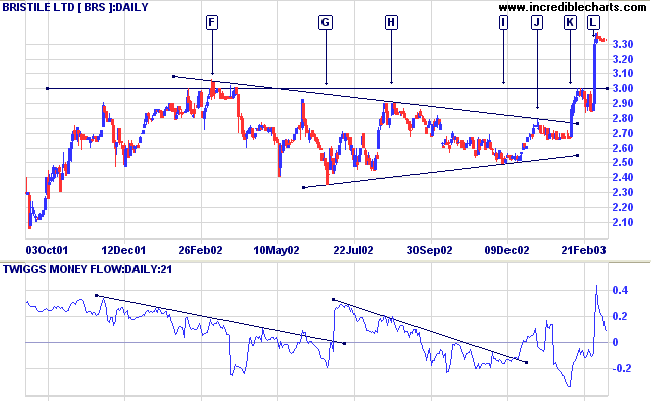
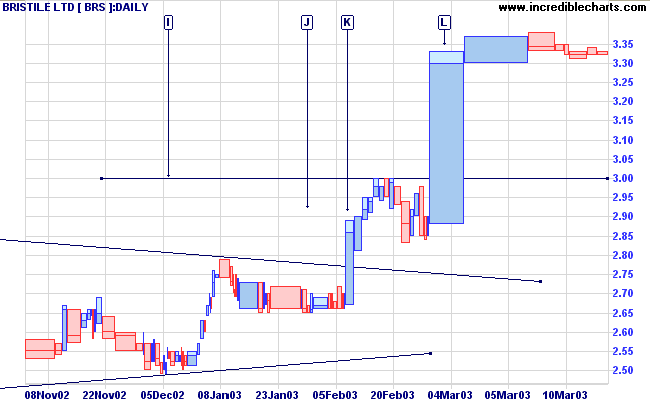
A break above resistance will be a bull signal ( a break below 3.00 would be bearish).
For further guidance see Understanding the Trading Diary.
Our doubts are traitors,
and make us lose the good we oft might win,
by fearing to attempt.
- William Shakespeare: Measure for Measure
Back Issues

Author: Colin Twiggs is a former investment banker with almost 40 years of experience in financial markets. He co-founded Incredible Charts and writes the popular Trading Diary and Patient Investor newsletters.
Using a top-down approach, Colin identifies key macro trends in the global economy before evaluating selected opportunities using a combination of fundamental and technical analysis.
Focusing on interest rates and financial market liquidity as primary drivers of the economic cycle, he warned of the 2008/2009 and 2020 bear markets well ahead of actual events.
He founded PVT Capital (AFSL No. 546090) in May 2023, which offers investment strategy and advice to wholesale clients.