The new Premium data will include exchange traded options;
updated at 5.30 p.m. (equity-based ETO's) and at 8.30 p.m. (all ETO's).
Trading Diary
March 10, 2003
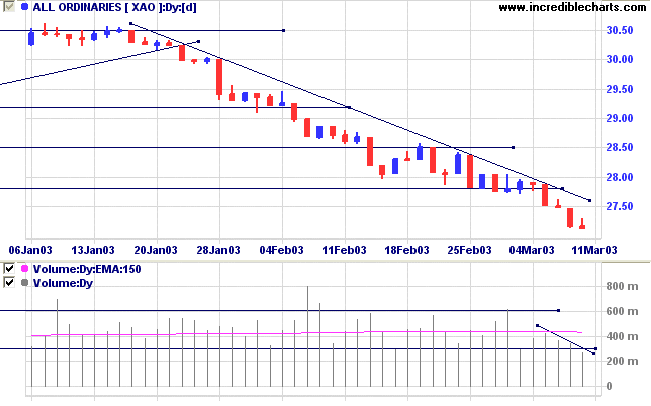
The intermediate cycle is down; the next support level is at 7500.
The primary trend is down.
Ignoring the reversal signal from Friday, the Nasdaq Composite closed 2.0% lower at 1278.
The intermediate trend is down, with the next support level at 1200.
The primary trend is up; a fall below 1108 will signal a reversal.
The S&P 500 lost 21 points to close at 807.
The intermediate trend is down.
The primary trend is down; the next support level is at 768.
The Chartcraft NYSE Bullish % Indicator fell to 38% (March 7).
The market awaits the vote on the UN security council resolution proposed by the US, Britain and Spain. France and Russia threaten to exercise their veto. (more)
New York (18.30): Spot gold is up 440 cents at $US 354.50.
Last covered on February 11, 2003.
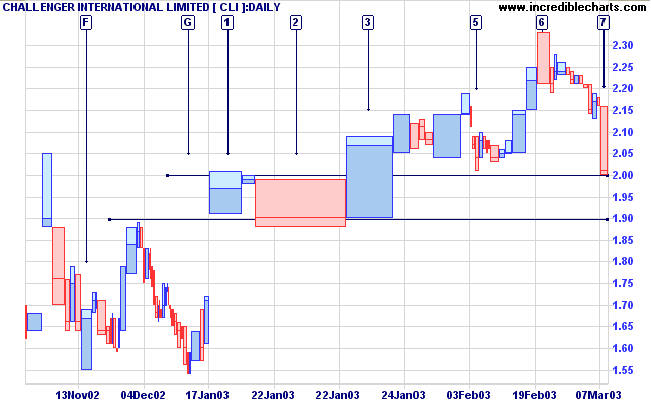
CLI formed a double bottom at [F] and [G] after a lengthy down-trend. The base appeared too narrow to support a strong rally and we now observe a bearish divergence on MACD and Twiggs Money Flow.
Relative Strength (price ratio: xao) is negative and the Financial sector is weak.
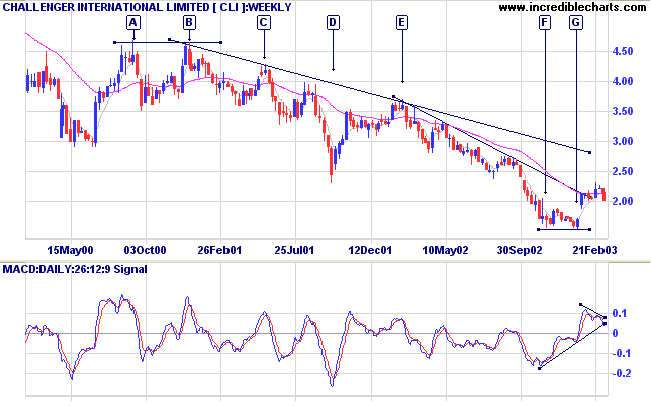
The lack of supporting volume is bearish and, unless we witness over-square bars between 1.90 and 2.00, expect a re-test of support at 1.55.
For further guidance see Understanding the Trading Diary.
Don't try to buy at the bottom and sell at the top.
It can't be done except by liars.
- Bernard Baruch
Back Issues

Author: Colin Twiggs is a former investment banker with almost 40 years of experience in financial markets. He co-founded Incredible Charts and writes the popular Trading Diary and Patient Investor newsletters.
Using a top-down approach, Colin identifies key macro trends in the global economy before evaluating selected opportunities using a combination of fundamental and technical analysis.
Focusing on interest rates and financial market liquidity as primary drivers of the economic cycle, he warned of the 2008/2009 and 2020 bear markets well ahead of actual events.
He founded PVT Capital (AFSL No. 546090) in May 2023, which offers investment strategy and advice to wholesale clients.