|
|
|
WineOrb, Australia's premium fine wine
broker, are offering a free Masterclass for you and your
partner, to show you what to look for when making an
investment in wine. Complete the form on our site and tell us in less than 25 words why you would like to attend. The best entries will be invited to join us at the Masterclass on the 16th May 2003. Click here to enter. |
Trading Diary
March 3, 2003
The primary trend is down.
The Nasdaq Composite formed a key reversal, closing down 1.3% at 1320. The equal highs (on 21/2 and 3/3) signal that the index is likely to weaken. The next support level is at 1200.
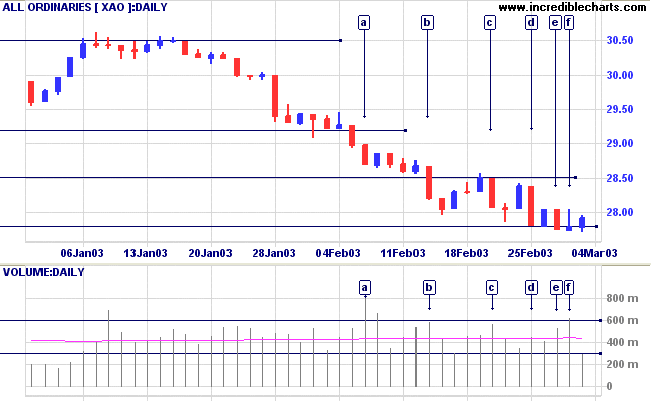
The primary trend is up.
The S&P 500 lost 7 points to close at 834. The index also displays equal highs, signaling weakness. The next support level is at 768.
The primary trend is down.
The Chartcraft NYSE Bullish % Indicator is at 40% (February 28).
The Institute of Supply Management's manufacturing index fell to a lower than expected 50.5, from 53.9 in January. (more)
New York (17.15): After early weakness, spot gold rallied to an unchanged $US 349.70.
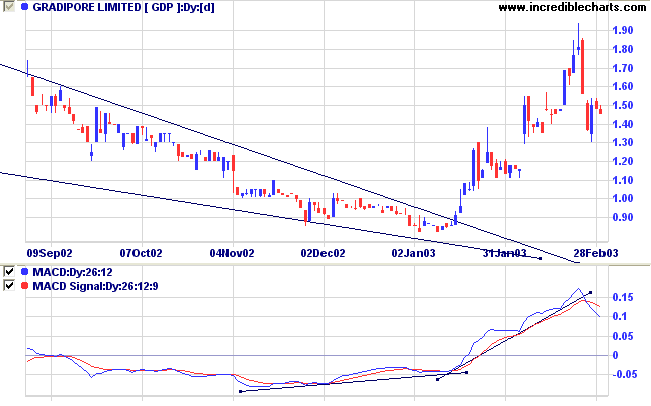
Slow Stochastic (20,3,3) and MACD (26,12,9) are below their signal lines, but both are threatening to cross. Twiggs Money Flow still shows a small bullish divergence.
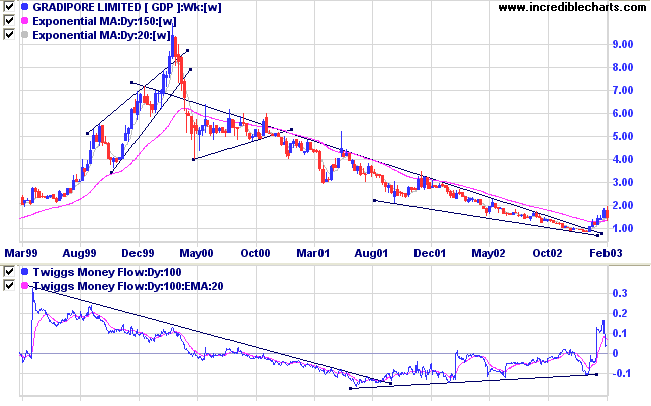
This biotech stock was the subject of recent discussion on the Chart Forum.
After the up-trend accelerated into a spike in early 2000, GDP formed a congestion pattern in the form of a triangle before commencing a stage 4 down-trend. The 100-day Twiggs Money Flow had shown bullish divergences for some time, before price broke above the downward trend line in January 2003 and rose above the 150-day exponential moving average.
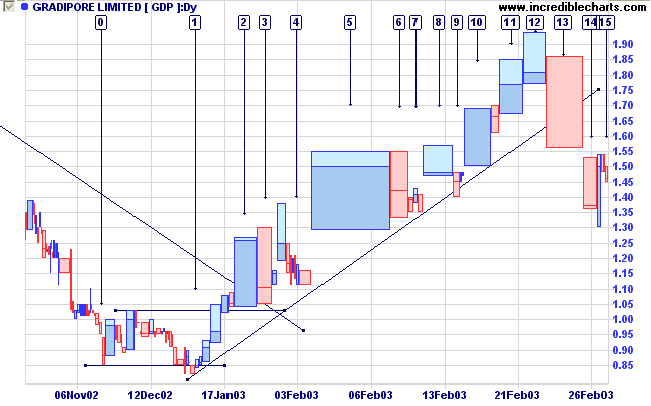
This was followed by a power box at [2], breaking above resistance.
But a sharp retreat at [3] signaled nervousness.
Volume dried up markedly at [4], signaling a short-term buying opportunity.
GDP then gapped up at [5]. Gaps often exhaust short-term momentum, especially when accompanied by heavy volume, and lead to a consolidation as at [6].
The pattern repeats itself, with volume drying up on the correction, followed by a gap up on heavy volume, at [8] and again at [10].
The trend then rolls over after a surge in volume, with weaker closes at [11] and [12] followed by a sell-off on heavy volume at [13].
Price gaps down at [14], which exhausts the downward momentum, but volume dries up on the counter-trend.
For further guidance see Understanding the Trading Diary.
Do you have the patience to wait
till the mud settles and the water is clear?
Can you remain unmoving
till the right action arises by itself?
- Lao Tse.
Back Issues

Author: Colin Twiggs is a former investment banker with almost 40 years of experience in financial markets. He co-founded Incredible Charts and writes the popular Trading Diary and Patient Investor newsletters.
Using a top-down approach, Colin identifies key macro trends in the global economy before evaluating selected opportunities using a combination of fundamental and technical analysis.
Focusing on interest rates and financial market liquidity as primary drivers of the economic cycle, he warned of the 2008/2009 and 2020 bear markets well ahead of actual events.
He founded PVT Capital (AFSL No. 546090) in May 2023, which offers investment strategy and advice to wholesale clients.