Those readers who have had difficulty registering for the Chart Forum,
or uploading chart images to their posts:
Please refer to Forum Troubleshooting for assistance.
Trading Diary
February 20, 2003
The primary trend is down.
The Nasdaq Composite formed another inside day, closing down 3 points at 1331.
The primary trend is up.
The S&P 500 lost 8 points to close at 837, resuming the down-trend (secondary/intermediate cycle). The next support level is 768.
The primary trend is down.
The Chartcraft NYSE Bullish % Indicator is at 42% (February 19).
January producer price index jumped 1.6%, the biggest increase since 1990, while jobless claims are back above 400,000. (more)
New York (16.50): Spot gold is up 340 cents at $US 352.40.
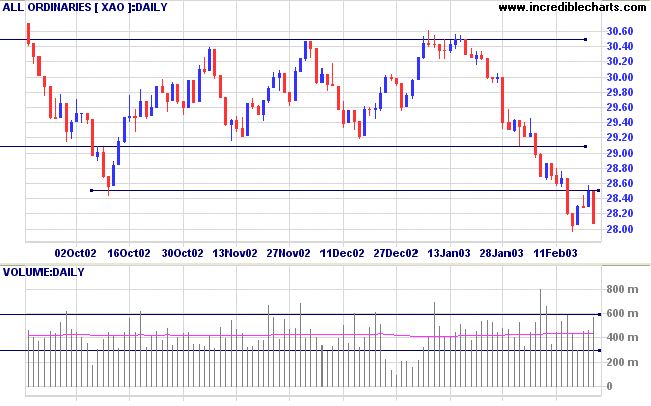
The next support level is at 2779 (from October 1999).
Slow Stochastic (20,3,3) is above its signal line; MACD (26,12,9) is below. Twiggs Money Flow closed lower, signaling distribution.
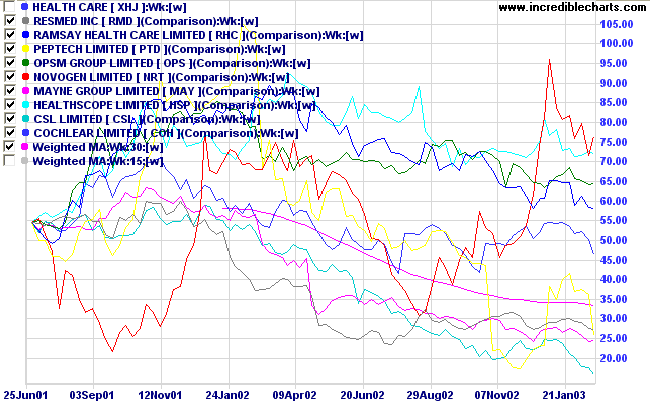
The chart below shows the comparative performance (using Price Comparison) of sector indices over the past 18 months against a 30-week weighted moving average of the XJO.
The strongest-looking sector is Utilities
while Health Care
and Financials (excl. Property)
presently look the weakest (Information Technology and Consumer Discretionary appear to be leveling off).

For further guidance see Understanding the Trading Diary.
During my eighty-seven years I have witnessed
a whole succession of technological revolutions.
But none of them has done away with the need for character in
the individual or the ability to think.
- Bernard Baruch.
Back Issues

Author: Colin Twiggs is a former investment banker with almost 40 years of experience in financial markets. He co-founded Incredible Charts and writes the popular Trading Diary and Patient Investor newsletters.
Using a top-down approach, Colin identifies key macro trends in the global economy before evaluating selected opportunities using a combination of fundamental and technical analysis.
Focusing on interest rates and financial market liquidity as primary drivers of the economic cycle, he warned of the 2008/2009 and 2020 bear markets well ahead of actual events.
He founded PVT Capital (AFSL No. 546090) in May 2023, which offers investment strategy and advice to wholesale clients.