Those readers who have had difficulty registering for the Chart Forum,
or uploading chart images to their posts:
Please refer to Forum Troubleshooting for assistance.
Trading Diary
February 17, 2003
The Chartcraft NYSE Bullish % Indicator is at 42% (February 14).
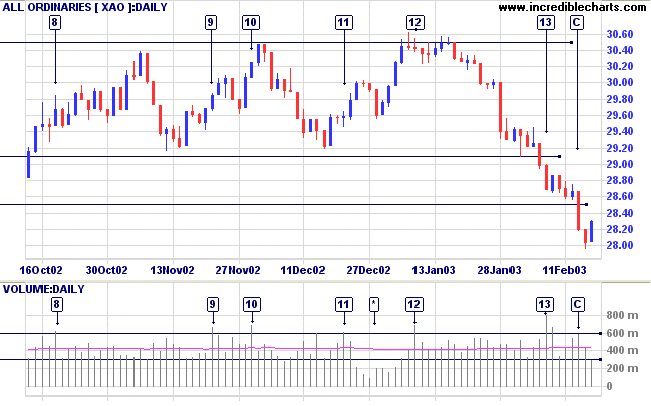
Global markets rallied as the likelihood of an immediate war with Iraq fades, while gold and oil declined. (more)
New York (16.45): Spot gold is 460 cents down at $US 346.70.
Slow Stochastic (20,3,3) is above its signal line; MACD (26,12,9) is below; Twiggs Money Flow signals distribution.

Last covered on November 13, 2002.
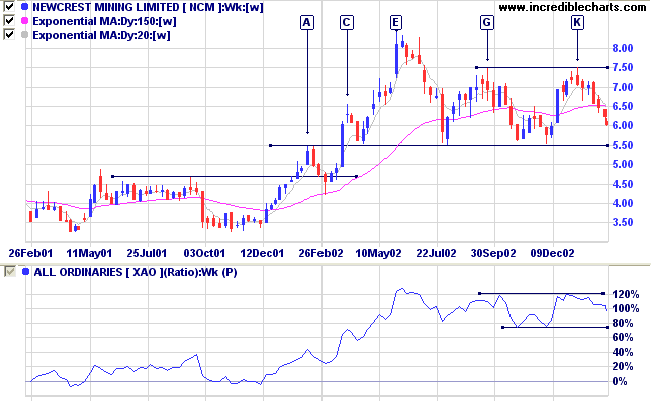
After a fast up-trend NCM formed a high at [E] before retreating back to the 5.50 support level. The stock is now ranging between 7.50 and 5.50. The lower equal highs at [G] and [K] (some would call this a double top - even though the neckline is not yet broken) are a strong bear signal and NCM appears headed for a re-test of the 5.50 support level. There has been no significant fading of volume towards the peaks, nor surge in volume on the declines, so we will have to observe the behavior of the stock when it reaches the support level.
Relative Strength (price ratio:xao) is moving sideways; MACD is bearish; and Twiggs Money Flow signals distribution.

For further guidance see Understanding the Trading Diary.
Every man is proud of what he does
well;
and no man is proud of what he does not do well.
With the former, his heart is in his work;
and he will do twice as much of it with less
fatigue.
The latter performs a little imperfectly, looks at it in
disgust,
turns from it, and imagines himself exceedingly
tired.
The little he has done, comes to nothing, for want of
finishing.
- Abraham Lincoln (1859)
Back Issues

Author: Colin Twiggs is a former investment banker with almost 40 years of experience in financial markets. He co-founded Incredible Charts and writes the popular Trading Diary and Patient Investor newsletters.
Using a top-down approach, Colin identifies key macro trends in the global economy before evaluating selected opportunities using a combination of fundamental and technical analysis.
Focusing on interest rates and financial market liquidity as primary drivers of the economic cycle, he warned of the 2008/2009 and 2020 bear markets well ahead of actual events.
He founded PVT Capital (AFSL No. 546090) in May 2023, which offers investment strategy and advice to wholesale clients.
