Those readers who have had difficulty registering for the Chart Forum,
or uploading chart images to their posts:
Please refer to Forum Troubleshooting for assistance.
Trading Diary
February 13, 2003
The primary trend is down.
The Nasdaq Composite lost 1 point to close at 1277.
The next major support level is at 1200.
The primary trend is up (the last low was 1108, the last high 1521).
The S&P 500 lost 1 point to close at 817.
The index has formed a base between 768 and 964 but appears headed for a re-test of the support level.
The Chartcraft NYSE Bullish % Indicator is at 44% (February 12).
January retail sales fell 0.9%, according to the US Commerce Department, after a 2% rise in December. (more)
New York (16.30): Spot gold had gained 350 cents to $US 356.10.
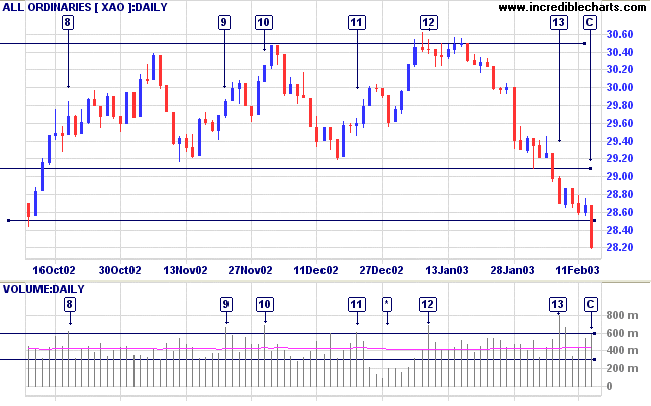
The short-term "bounce" failed to materialize and we will see over the next few days if the lower end of the 2850 to 2779 support band is able to hold.
Slow Stochastic (20,3,3) is below its signal line; MACD (26,12,9) is below; Twiggs Money Flow signals distribution.
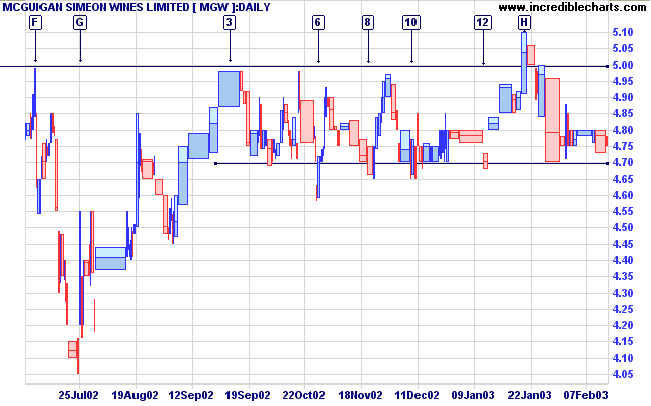
Last covered on October 9, 2002.
MGW has maintained a stage 2 up-trend for the past 7 years. In 1998 at [A] the slow up-trend accelerated into a fast trend, until the correction from [B] to [C]. At [C] MGW reversed into another fast up-trend, culminating in a top at [D]. The top from [D] to [H] has formed a bullish ascending triangle below the resistance level at 5.00.
Relative Strength (price ratio:xao) is still rising, while MACD is neutral, whipsawing around the zero line.
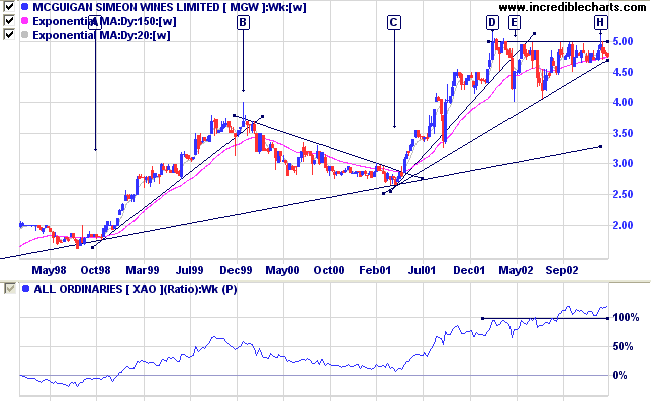
Twiggs Money Flow signals strong accumulation.
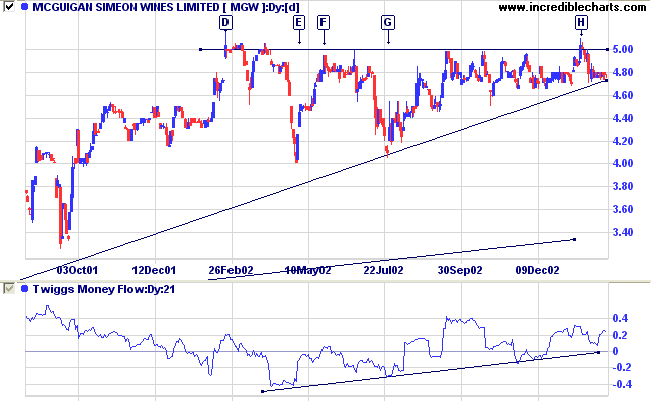
A breakout above 5.00 will be a strong bull signal, while a break below 4.70 would be bearish. There are a number of false breaks below 4.70, at [6], [8], [10] and [12], and one above 5.00, at [H]. It would be prudent to wait for price to respect the new support level (after an upward breakout) or the new resistance level (after a bearish breakout) before entering.
For further guidance see Understanding the Trading Diary.
It is unwise to be too sure of one's own
wisdom.
It is healthy to be reminded that the strongest might
weaken
and the wisest might err.
- Mahatma Gandhi
Back Issues

Author: Colin Twiggs is a former investment banker with almost 40 years of experience in financial markets. He co-founded Incredible Charts and writes the popular Trading Diary and Patient Investor newsletters.
Using a top-down approach, Colin identifies key macro trends in the global economy before evaluating selected opportunities using a combination of fundamental and technical analysis.
Focusing on interest rates and financial market liquidity as primary drivers of the economic cycle, he warned of the 2008/2009 and 2020 bear markets well ahead of actual events.
He founded PVT Capital (AFSL No. 546090) in May 2023, which offers investment strategy and advice to wholesale clients.