after all the data is in place and the free trial commences.
Subscription/Registration forms will be available from the start of the free trial period.
We will keep you informed of progress.
Trading Diary
February 6, 2003
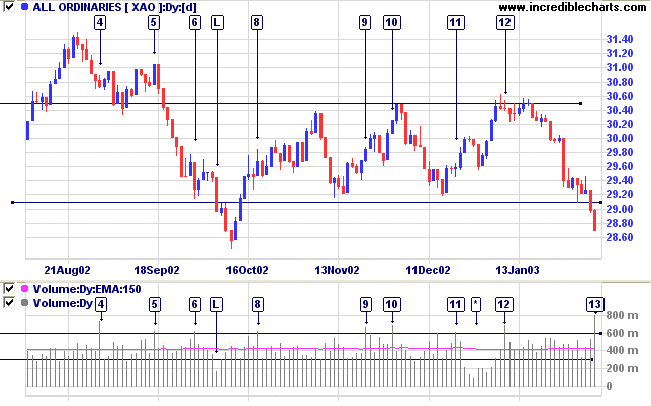
This is likely to resolve as a continuation pattern and the index appears headed for a re-test of support at 7500.
The primary trend is down.
The Nasdaq Composite closed unchanged at 1301. The next major support level is at 1200.
The primary trend is up (the last low was 1108, the last high 1521).
The S&P 500 has broken below its congestion pattern, closing down 5 points at 838.
The index has formed a base between 768 and 964 but appears headed for a re-test of the support level.
The Chartcraft NYSE Bullish % Indicator is on a bull correction signal at 46% (February 5).
A divergence started in 1999 between the declared earnings of S&P 500 stocks and their taxable income. (more)
New York (18.30): Spot gold has stabilized at $US 368.80.
Slow Stochastic (20,3,3) is below its signal line; MACD (26,12,9) is below; Twiggs Money Flow signals distribution.
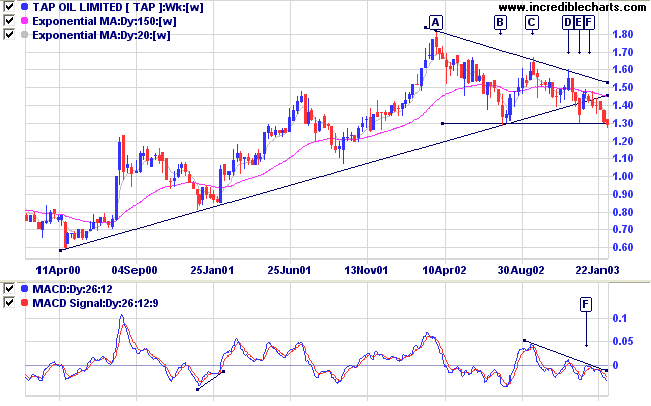
TAP formed a stage 3 top in the shape of a descending triangle, [A] to [F], after a stage 2 up-trend. After one or two false breaks, the stock has breached its' long-term trendline and completed the triangle with a break below 1.30.
Twiggs Money Flow signals distribution and MACD has completed a strong bear signal with a peak below zero at [F].
Relative Strength (price ratio: xao) is also declining.
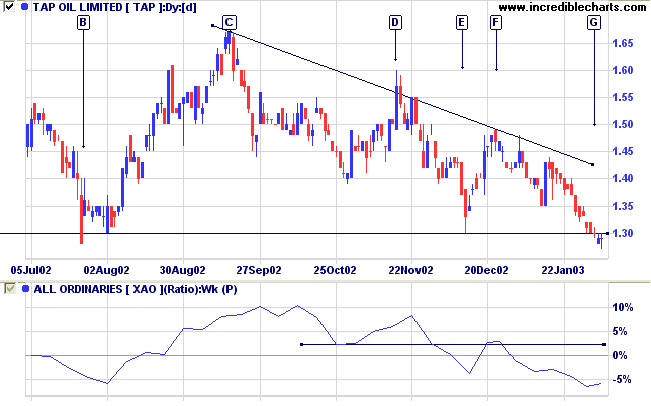
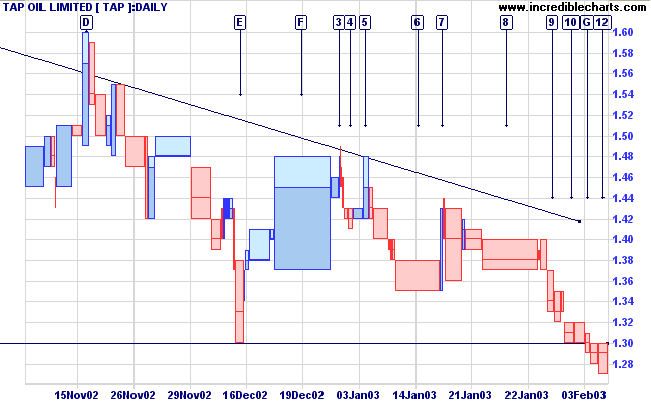
Buying seems to have dried up and TAP has fallen below the base of the triangle at [G]. Volume is light and we now see congestion at [12], just below the 1.30 resistance level. A failure to break above resistance in the next few days will be a strong bear signal as will a break below the low of [12], especially if accompanied by strong volume.
For further guidance see Understanding the Trading Diary.
The dogmas of the quiet past, are
inadequate to the stormy present.
The occasion is piled high with difficulty, and we
must rise - with the occasion.
As our case is new, so we must think anew, and act
anew....
- Abraham Lincoln: Second Annual Message to Congress
(1862)
Back Issues

Author: Colin Twiggs is a former investment banker with almost 40 years of experience in financial markets. He co-founded Incredible Charts and writes the popular Trading Diary and Patient Investor newsletters.
Using a top-down approach, Colin identifies key macro trends in the global economy before evaluating selected opportunities using a combination of fundamental and technical analysis.
Focusing on interest rates and financial market liquidity as primary drivers of the economic cycle, he warned of the 2008/2009 and 2020 bear markets well ahead of actual events.
He founded PVT Capital (AFSL No. 546090) in May 2023, which offers investment strategy and advice to wholesale clients.