after all the data is in place and the free trial commences.
Subscription/Registration forms will be available from the start of the free trial period.
We will keep you informed of progress.
Trading Diary
January 31, 2003
The primary trend is down.
The Nasdaq Composite closed 2 points down at 1320. The next major support level is at 1200.
The primary trend is up.
The S&P 500 gained 11 points to close at 855. The index appears headed for a re-test of support at 768.
The Chartcraft NYSE Bullish % Indicator is on a bull correction signal at 48% (January 30).
GDP grew just 0.7% in the fourth-quarter compared to 4.0% in the third, according to the US Commerce Department. (more)
New York (17:00): After trading above 372.00 earlier, spot gold pulled back to close at $US 367.40.
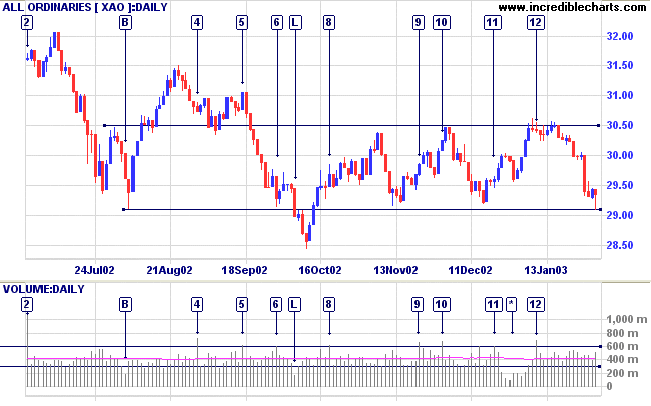
The index has, so far, failed to breach the 2915 support level.
Slow Stochastic (20,3,3) and MACD (26,12,9) are below their signal lines; Twiggs Money Flow signals distribution.


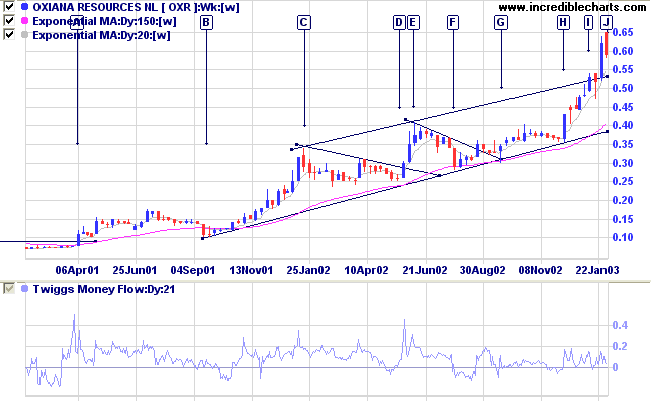
One of the better-performing gold stocks, OXR broke out of its base at [A] and entered a stage 2 up-trend. The stock formed an excellent trend channel, only recently penetrated by the spike at [J].
Relative Strength (price ratio: xao) and MACD are rising strongly. Twiggs Money Flow continues to signal accumulation.

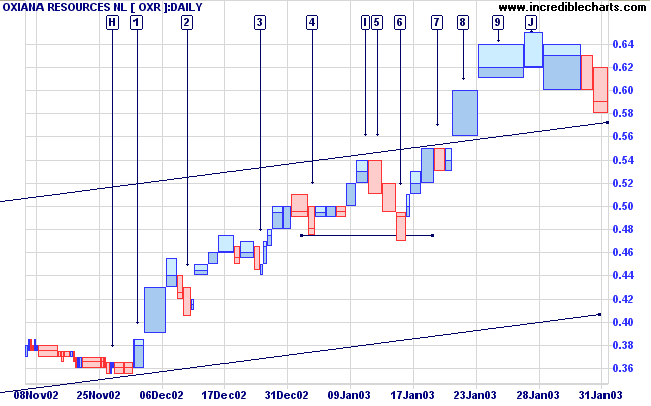
Stops can then be moved up to [2], [3] and [4] as the rally progresses. When price reaches the upper trendline at [I], the position can either be closed or a sell-stop placed below the low, exiting at [5].

OXR then breaks the upper trend channel at [8] after momentary hesitation at [7]. Tighter stop-losses should be implemented outside of the trend channel, trailing below the 1,2 or 3 day low (or using a Trailing % Stop). Increased volume and a long shadow at [9] signals heavy resistance and the sell-stop may be tightened even further, to lock in profits. Most of these strategies would exit the position at either 0.60 or 0.59.
Changes are highlighted in bold.
- Energy [XEJ] - stage 4 (RS is level)
- Materials [XMJ] - stage 2 (RS is rising)
- Industrials [XNJ] - stage 4 (RS is rising)
- Consumer Discretionary [XDJ] - stage 2 (RS is rising)
- Consumer Staples [XSJ] - stage 4 (RS is rising)
- Health Care [XHJ] - stage 1 (RS is level)
- Property Trusts [XPJ] - stage 2 (RS is rising)
- Financial excl. Property Trusts [XXJ] - stage 4 (RS is falling)
- Information Technology [XIJ] - stage 4 (RS is falling)
- Telecom Services [XTJ] - stage 4 (RS is falling)
- Utilities [XUJ] - stage 2 (RS is rising)
A stock screen of the ASX 200 using % Price Move (1 month: +5%) returned 30 stocks (compared to 99, August 23rd and 10 on October 4th). Notable sectors are:
- Diversified Financial Services
- Diversified Metals & Mining
For further guidance see Understanding the Trading Diary.
Because if it is not excellent, it will not be profitable or fun,
and if you are not in business for fun or profit,
what the hell are you doing there?
- Robert Townsend: Up the Organization
Back Issues

Author: Colin Twiggs is a former investment banker with almost 40 years of experience in financial markets. He co-founded Incredible Charts and writes the popular Trading Diary and Patient Investor newsletters.
Using a top-down approach, Colin identifies key macro trends in the global economy before evaluating selected opportunities using a combination of fundamental and technical analysis.
Focusing on interest rates and financial market liquidity as primary drivers of the economic cycle, he warned of the 2008/2009 and 2020 bear markets well ahead of actual events.
He founded PVT Capital (AFSL No. 546090) in May 2023, which offers investment strategy and advice to wholesale clients.
