2003 Membership
The reduced subscription to existing members
will run for at least 4 weeks
after all the data is in place and the free trial commences.
Subscription/Registration forms will be available from the start of the free trial period.
We will keep you informed of progress.
after all the data is in place and the free trial commences.
Subscription/Registration forms will be available from the start of the free trial period.
We will keep you informed of progress.
Trading Diary
January 24, 2003
These extracts from my daily trading diary are
intended to illustrate the techniques used in short-term trading
and should not be interpreted as investment advice. Full terms
and conditions can be found at Terms
of Use .
USA
The Dow fell 2.8% to 8131 on strong volume,
breaking below 8215 and completing a head and shoulders pattern
(intermediate/secondary cycle). The pattern has a target of
7354.
The primary trend is down and will only reverse up if the Dow breaks above 9076 (the high from December 02).
The Nasdaq Composite lost 3.3% to close at 1342.
The primary trend is up.
The S&P 500 closed down 26 points at 861, below support at 867. This completes a head and shoulders pattern (intermediate/secondary cycle) with a target of 784, near the floor of the base (965 to 768).
The Chartcraft NYSE Bullish % Indicator is at 54% (January 23).
War jitters
Gold and treasury bonds rise, while the US dollar weakens, ahead of the UN weapons inspectors' report due Monday. (more)
Back Issues
Gold and treasury bonds rise, while the US dollar weakens, ahead of the UN weapons inspectors' report due Monday. (more)
AIG
Morgan Stanley downgrades the insurance sector, causing an 8% fall in the market's largest insurer. (more)
Gold
New York: Spot gold soared 470 cents to $US 367.70 at the close.
Morgan Stanley downgrades the insurance sector, causing an 8% fall in the market's largest insurer. (more)
Gold
New York: Spot gold soared 470 cents to $US 367.70 at the close.
ASX Australia
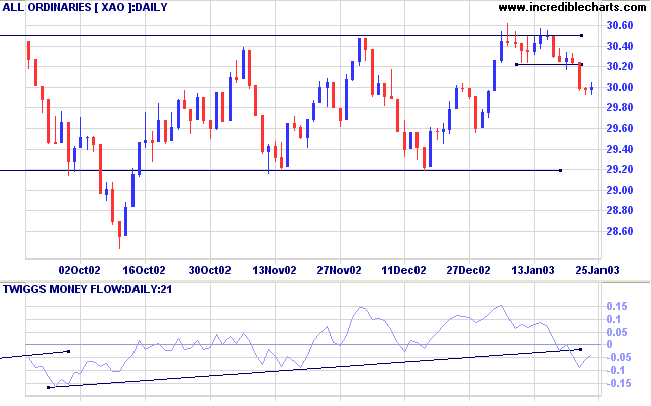
The All Ordinaries closed at 3000 on average volume. The
doji
signals continued buying support. The index has completed a
double top (short cycle) with a target of 2984.
Over the last 3 months the index has been forming a base between 2915 and 3050.
Slow Stochastic (20,3,3) and MACD (26,12,9) are below their signal lines; Twiggs Money Flow signals distribution.
Over the last 3 months the index has been forming a base between 2915 and 3050.
Slow Stochastic (20,3,3) and MACD (26,12,9) are below their signal lines; Twiggs Money Flow signals distribution.
Australian Stock Exchange [ASX]
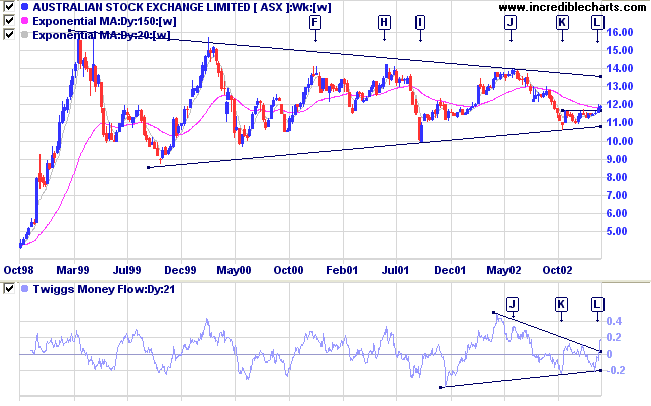
The ASX has formed a large symmetrical triangle since its high of March 1999. There have been several trading opportunities as price ranged between 10.00 and 14.00 over the last 2 years. Price has again turned up off the lower trendline at [K], completing a small ascending triangle at [L].
Relative Strength (price ratio: xao) is neutral, MACD is positive and Twiggs Money Flow signals accumulation.
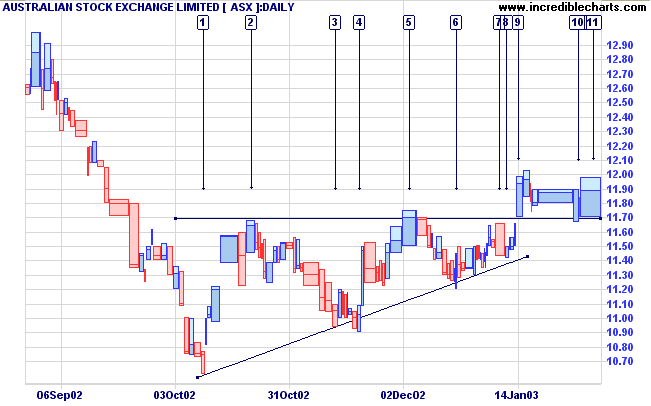
The ascending triangle can be seen in greater detail on the
Equivolume chart, starting at [1] with a breakout at [9]
(after a false break at [5]).
Note how volume dried up on the last down-swing at [8] before the breakout.
Price has since pulled back to 11.70, with the broad blue bars signaling strong buying support.
Note how volume dried up on the last down-swing at [8] before the breakout.
Price has since pulled back to 11.70, with the broad blue bars signaling strong buying support.
A break above 12.00 will be a strong bull signal
(short/medium-term). The target is the upper border of the
triangle on the weekly chart, between 13.00 and
13.50.
A break below 11.70 would be a bear signal and is a logical place to position a stop-loss.
A break below 11.70 would be a bear signal and is a logical place to position a stop-loss.
Sector Analysis
Changes are highlighted in bold.
Changes are highlighted in bold.
- Energy [XEJ] - stage 4 (RS is level)
- Materials [XMJ] - stage 2 (RS is rising)
- Industrials [XNJ] - stage 4 (RS is falling)
- Consumer Discretionary [XDJ] - stage 2 (RS is rising)
- Consumer Staples [XSJ] - stage 4 (RS is rising)
- Health Care [XHJ] - stage 1 (RS is level)
- Property Trusts [XPJ] - stage 2 (RS is rising)
- Financial excl. Property Trusts [XXJ] - stage 1 (RS is falling)
- Information Technology [XIJ] - stage 4 (RS is falling)
- Telecom Services [XTJ] - stage 4 (RS is falling)
- Utilities [XUJ] - stage 2 (RS is rising)
Sectors: Relative Strength
A stock screen of the ASX 200 using % Price Move (1 month: +5%) returned 51 stocks (compared to 99, August 23rd and 10 on October 4th). Notable sectors are:
A stock screen of the ASX 200 using % Price Move (1 month: +5%) returned 51 stocks (compared to 99, August 23rd and 10 on October 4th). Notable sectors are:
- Auto Parts & Equipment
- Diversified Financial Services
- Diversified Metals & Mining
- Gold
- Oil & Gas Exploration
- Steel
Market strategy
For further guidance see Understanding the Trading Diary.
For further guidance see Understanding the Trading Diary.
Short-term: Short. The Slow Stochastic and MACD are below
their respective signal lines.
Medium-term: Avoid new entries.
Long-term: Wait for confirmation of the
bottom reversal signal.
Colin Twiggs
In any moment of decision, the best thing
you can do is the right thing.
The worst thing you can do is nothing.
- Theodore Roosevelt.
The worst thing you can do is nothing.
- Theodore Roosevelt.
Back Issues
Click here to access the
Trading Diary Archives.
Back Issues
Access the Trading Diary Archives.

Author: Colin Twiggs is a former investment banker with almost 40 years of experience in financial markets. He co-founded Incredible Charts and writes the popular Trading Diary and Patient Investor newsletters.
Using a top-down approach, Colin identifies key macro trends in the global economy before evaluating selected opportunities using a combination of fundamental and technical analysis.
Focusing on interest rates and financial market liquidity as primary drivers of the economic cycle, he warned of the 2008/2009 and 2020 bear markets well ahead of actual events.
He founded PVT Capital (AFSL No. 546090) in May 2023, which offers investment strategy and advice to wholesale clients.