2003 Membership
The reduced subscription to existing members
will run for at least 4 weeks
after all the data is in place and the free trial commences.
Subscription/Registration forms will be available from the start of the free trial period.
We will keep you informed of progress.
after all the data is in place and the free trial commences.
Subscription/Registration forms will be available from the start of the free trial period.
We will keep you informed of progress.
Trading Diary
January 23, 2003
These extracts from my daily trading diary are
intended to illustrate the techniques used in short-term trading
and should not be interpreted as investment advice. Full terms
and conditions can be found at Terms
of Use .
USA
The Dow rose 0.6% to close at 8369 on higher
volume, holding above support at 8215 so far. A break below 8215
will complete a head and shoulders pattern
(intermediate/secondary cycle) with a target of 7354.
The index ranges between 8161 and 9076, at the top end of the base that has been forming since July 2002.
The primary trend is down and will only reverse up if the Dow breaks above 9076 (the high from December 02).
The Nasdaq Composite rallied 2.1% to 1388.
The primary trend is up.
The S&P 500 recovered 9 points to close at 887, holding above support at 867.
The index ranges between 965 and 768, establishing a base.
The Chartcraft NYSE Bullish % Indicator is at 54% (January 22).
Back Issues
The index ranges between 8161 and 9076, at the top end of the base that has been forming since July 2002.
The primary trend is down and will only reverse up if the Dow breaks above 9076 (the high from December 02).
The Nasdaq Composite rallied 2.1% to 1388.
The primary trend is up.
The S&P 500 recovered 9 points to close at 887, holding above support at 867.
The index ranges between 965 and 768, establishing a base.
The Chartcraft NYSE Bullish % Indicator is at 54% (January 22).
Nasdaq
Tech and telecom stocks surged after better-than-expected results from Texas Instruments, Lucent and Qualcomm. (more)
Gold
New York: Spot gold reached $US 365, a 6-year high, before easing to $US 363.00 at 16:00.
Tech and telecom stocks surged after better-than-expected results from Texas Instruments, Lucent and Qualcomm. (more)
Gold
New York: Spot gold reached $US 365, a 6-year high, before easing to $US 363.00 at 16:00.
ASX Australia
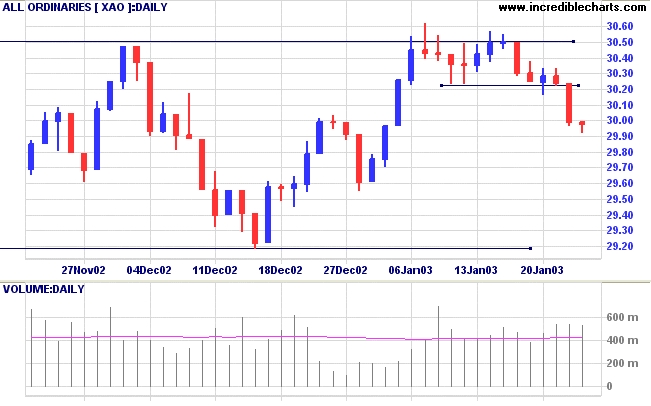
The All Ordinaries eased 1 point lower at 2998 on above-average
volume. The longish tail indicates buying support around 3000.
The index has completed a double top (short cycle) with a
target of 2984.
Over the last 3 months the index has been forming a base between 2915 and 3050.
Slow Stochastic (20,3,3) and MACD (26,12,9) are below their signal lines; Twiggs Money Flow signals distribution.
Over the last 3 months the index has been forming a base between 2915 and 3050.
Slow Stochastic (20,3,3) and MACD (26,12,9) are below their signal lines; Twiggs Money Flow signals distribution.
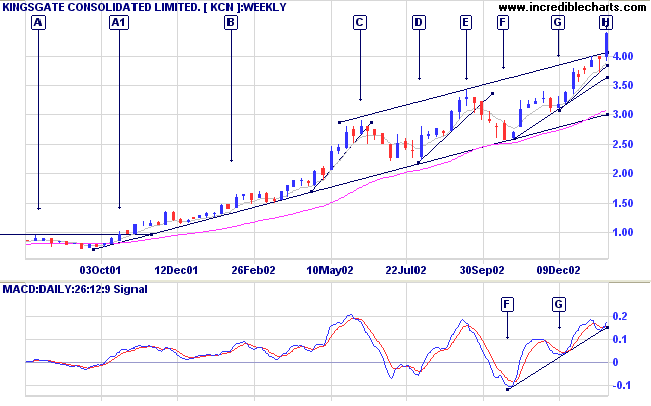
Kingsgate Consolidated [KCN]
The Thailand gold miner broke out of a stage 1 base at [A1] and has been in a stage 2 up-trend ever since. Not all trends are born equal: there is a creeping trend at [B] followed by fast rallies to [C] and [E] (and sharp reactions to [D] and [F]). Another fast rally has developed from [F] through [G] but we can now observe a third type of trend: the spike at [H]. When a fast trend accelerates into a spike, there is only one likely outcome: a trend at that pace is unsustainable and we can expect a sharp reversal back towards the long-term trend line.
As expected, Relative Strength (price ratio: xao) and Twiggs Money Flow are soaring. MACD shows strong bull signals at [G] and [H], with troughs above the zero line.
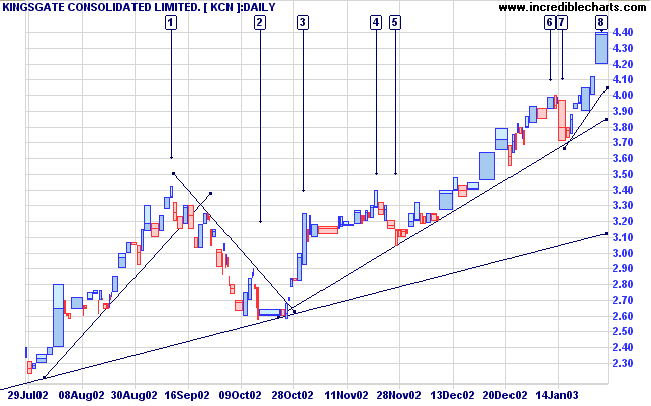
A spike should not be confused with the rapid rise when a
gradual trend accelerates into a fast trend, as from [2] to
[3] below. They are identified by strong volume; increasing
daily range, frequently accompanied by gaps; and acceleration
off an existing fast trend line.
The spike at [8] is only just starting and may carry a lot higher.
The spike at [8] is only just starting and may carry a lot higher.
Traders need to have a strategy for taking profits during
such spikes. A trailing percentage stop may be the answer.
Moving average crossovers will have too much lag for such a
volatile market and you may find that when you close the
gate, the horse has already bolted.
Market strategy
For further guidance see Understanding the Trading Diary.
For further guidance see Understanding the Trading Diary.
Short-term: Take short entries. The Slow Stochastic and MACD
are below their respective signal lines.
Medium-term: Avoid new entries.
Long-term: Wait for confirmation of the
bottom reversal signal.
Colin Twiggs
No problem can be solved until it is reduced
to some simple form.
The changing of a vague difficulty into a specific, concrete form
is a very essential element in thinking.
- John Pierpont Morgan.
The changing of a vague difficulty into a specific, concrete form
is a very essential element in thinking.
- John Pierpont Morgan.
Back Issues
Click here to access the
Trading Diary Archives.
Back Issues
Access the Trading Diary Archives.

Author: Colin Twiggs is a former investment banker with almost 40 years of experience in financial markets. He co-founded Incredible Charts and writes the popular Trading Diary and Patient Investor newsletters.
Using a top-down approach, Colin identifies key macro trends in the global economy before evaluating selected opportunities using a combination of fundamental and technical analysis.
Focusing on interest rates and financial market liquidity as primary drivers of the economic cycle, he warned of the 2008/2009 and 2020 bear markets well ahead of actual events.
He founded PVT Capital (AFSL No. 546090) in May 2023, which offers investment strategy and advice to wholesale clients.