2003 Membership
The reduced subscription to existing members
will run for at least 4 weeks
after all the data is in place and the free trial commences.
Subscription/Registration forms will be available from the start of the free trial period.
We will keep you informed of progress.
after all the data is in place and the free trial commences.
Subscription/Registration forms will be available from the start of the free trial period.
We will keep you informed of progress.
Trading Diary
January 22, 2003
These extracts from my daily trading diary are
intended to illustrate the techniques used in short-term trading
and should not be interpreted as investment advice. Full terms
and conditions can be found at Terms
of Use .
USA
The Dow fell a further 1.5% to 8315 on average
volume. A break below 8215 will complete a head and shoulders
pattern (intermediate/secondary cycle) with a target of
7354.
The average ranges between 8161 and 9076, at the top end of the base that has been forming since July 2002.
The primary trend is down and will only reverse up if the average rises above 9076 (the high from December 02).
The Nasdaq Composite lost 5 points to close at 1359.
The primary trend is up.
The S&P 500 lost 9 to close at 878, approaching support at 867.
The index ranges between 965 and 768, establishing a base.
The Chartcraft NYSE Bullish % Indicator is at 54% (January 21).
Back Issues
The average ranges between 8161 and 9076, at the top end of the base that has been forming since July 2002.
The primary trend is down and will only reverse up if the average rises above 9076 (the high from December 02).
The Nasdaq Composite lost 5 points to close at 1359.
The primary trend is up.
The S&P 500 lost 9 to close at 878, approaching support at 867.
The index ranges between 965 and 768, establishing a base.
The Chartcraft NYSE Bullish % Indicator is at 54% (January 21).
Kodak
Eastman Kodak lowers its earnings outlook and plans to cut about 3% of its workforce.
Gold
New York: Spot gold climbed a further 210 cents to $US 360.00
Eastman Kodak lowers its earnings outlook and plans to cut about 3% of its workforce.
Gold
New York: Spot gold climbed a further 210 cents to $US 360.00
ASX Australia
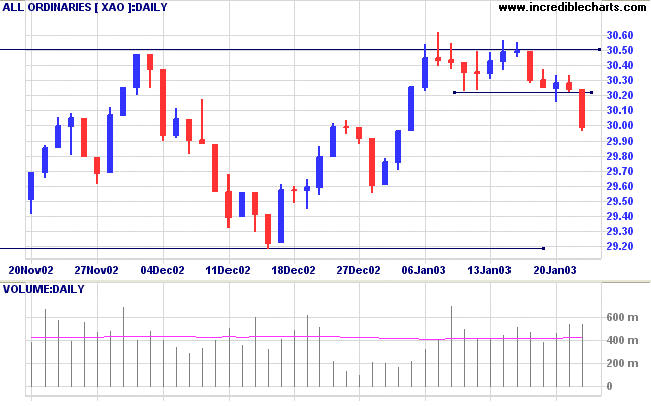
The All Ordinaries dropped through the 3023 support level to
close at 2999 on higher volume. The index has completed a
double top (short cycle) with a target of 2984.
The index ranges between 2915 and 3050, forming a base.
Slow Stochastic (20,3,3) and MACD (26,12,9) are below their signal lines; Twiggs Money Flow signals distribution.
The index ranges between 2915 and 3050, forming a base.
Slow Stochastic (20,3,3) and MACD (26,12,9) are below their signal lines; Twiggs Money Flow signals distribution.
Foodland [FOA]
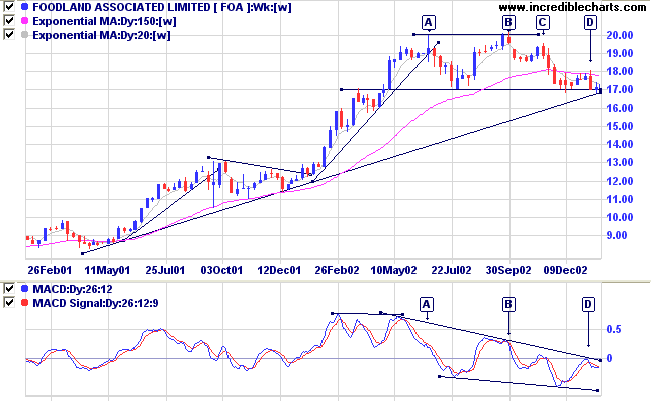
Last covered on December 6, 2002.
FOA is in a stage 3 top after a long up-trend. A double top has been completed after equal highs at [A] and [B].
The stock subsequently formed a bearish lower high at [C] before testing support at 17.00. The next high at [D] is even weaker, signaling the likelihood of a break below support at 17.00, which will commence a stage 4 down-trend.
Relative Strength (price ratio: xao) is weakening. MACD has shown bearish divergences at both [A] and [B] and has now completed a strong bear signal with a peak below zero at [D].
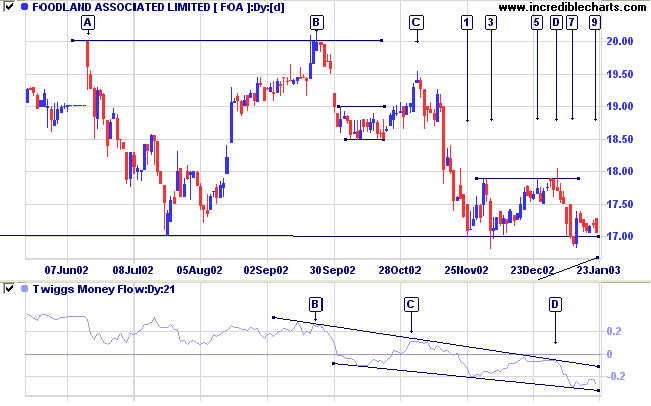
Twiggs Money Flow shows distribution, with a strong bear
signal at [D] similar to the MACD.
Note the false break at [B], where price reached a new high but failed to close above 20.00. There are further false breaks, below the support level at [3] and [7], and above resistance at [5].
Note the false break at [B], where price reached a new high but failed to close above 20.00. There are further false breaks, below the support level at [3] and [7], and above resistance at [5].
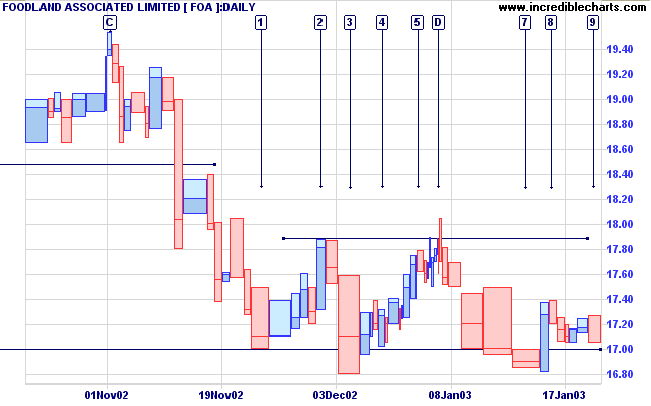
The Equivolume chart shows thinner volume on the rallies than
on the down-trends.
Because of the number of false breaks it will be prudent to wait for a break below 17.00 and a successful re-test of the new resistance level before entering/increasing any short positions.
Because of the number of false breaks it will be prudent to wait for a break below 17.00 and a successful re-test of the new resistance level before entering/increasing any short positions.
Market strategy
For further guidance see Understanding the Trading Diary.
For further guidance see Understanding the Trading Diary.
Short-term: Short.The Slow Stochastic and MACD are below
their respective signal lines.
Medium-term: Avoid new entries.
Long-term: Wait for confirmation of the
bottom reversal signal.
Colin Twiggs
A man always has two reasons for doing
anything
- a good reason and the real reason.
- John Pierpont Morgan.
- a good reason and the real reason.
- John Pierpont Morgan.
Back Issues
Click here to access the
Trading Diary Archives.
Back Issues
Access the Trading Diary Archives.

Author: Colin Twiggs is a former investment banker with almost 40 years of experience in financial markets. He co-founded Incredible Charts and writes the popular Trading Diary and Patient Investor newsletters.
Using a top-down approach, Colin identifies key macro trends in the global economy before evaluating selected opportunities using a combination of fundamental and technical analysis.
Focusing on interest rates and financial market liquidity as primary drivers of the economic cycle, he warned of the 2008/2009 and 2020 bear markets well ahead of actual events.
He founded PVT Capital (AFSL No. 546090) in May 2023, which offers investment strategy and advice to wholesale clients.